







Open Range Breakout DAX 5/15M
Hi guys,
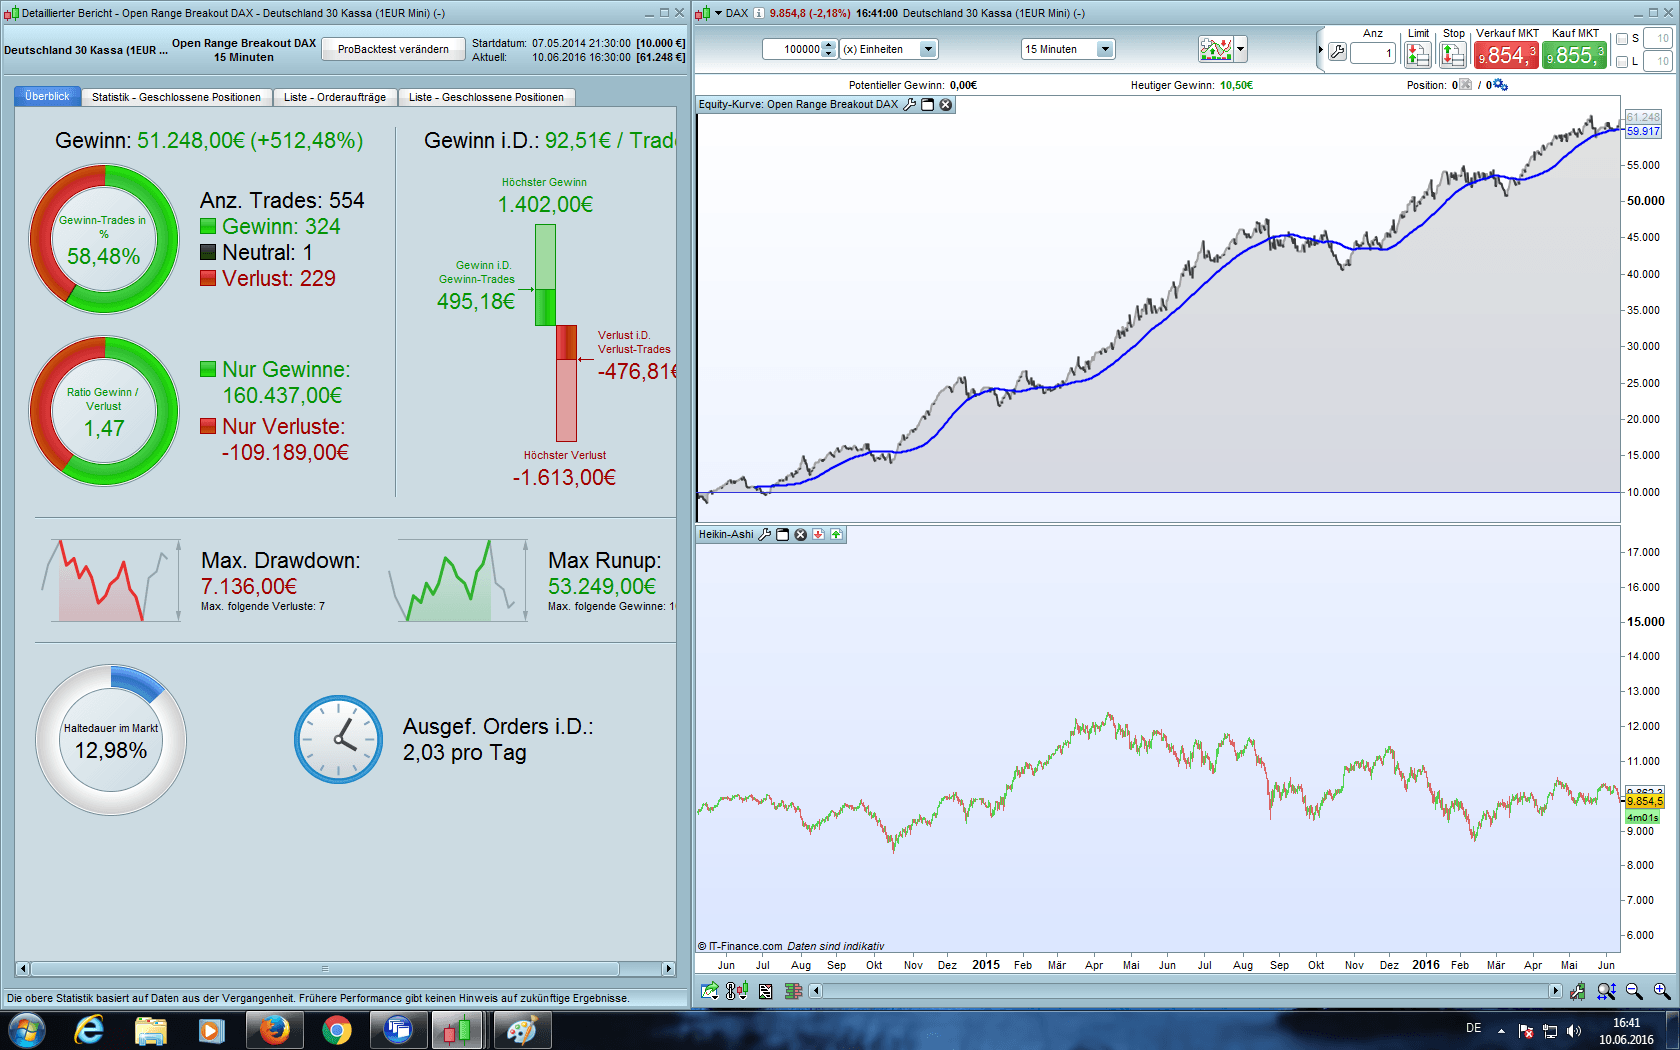
Open range breakout systems are very popular. They are simple and reliable with volatile instruments like the DAX. I trade the ORB together with the equity curve because as all breakout systems they could have some ugly drawdown phases. These concept is very easy and is described perfectly here in the Blog. Add to the equity curve a simple moving average and trade only if the curve is above the MA could help to avoid ugly losses.
I want to share an easy ORB strategy works profitable in M5 and M15 – this is not a big thing but maybe helpful for some PRT beginners.
have fun
Reiner
// Open Range Breakout DAX 5/15M

// code-parameter
DEFPARAM FlatAfter = 173000

// window high/low calculation
ONCE StartTime = 90000
ONCE EndTime = 93000

// trading window
ONCE BuyTime = 93000
ONCE SellTime = 173000

// money management
ONCE Capital = 10000
ONCE Risk = 0.01
ONCE StopLoss = 10
ONCE equity = Capital + StrategyProfit
ONCE maxrisk = round(equity*Risk)
ONCE PositionSize = abs(round((maxrisk/StopLoss)/PointValue)*pipsize)
// fixed position size
//ONCE PositionSize = 10

//signal line
signal = Tema[5](close)

// calculate high/low and sl/tp
IF Time >= StartTime AND Time <= EndTime THEN
 IF TIME = StartTime THEN
  DailyHigh = High
  DailyLow = Low
 ENDIF
 IF High > DailyHigh THEN
  DailyHigh = High
 ENDIF
 IF Low < DailyLow THEN
 DailyLow = Low
 ENDIF

 sl = DailyHigh - DailyLow
 tp = sl

 TradeCounterLong = 0
 TradeCounterShort = 0
ENDIF

// position management
IF Time >= BuyTime AND Time <= SellTime THEN
 // Long
 IF Not LONGONMARKET AND signal CROSSES OVER DailyHigh AND TradeCounterLong = 0 THEN
 // long
  IF (Time >= 93000 AND Time <= 113000) OR (Time >= 130000 AND Time <= 171500) THEN // no trading during lunch
   BUY PositionSize CONTRACT AT MARKET
   TradeCounterLong = TradeCounterLong + 1
  ENDIF
 ENDIF
// short
 IF Not SHORTONMARKET AND signal CROSSES UNDER DailyLow AND close < DClose(1) AND TradeCounterShort = 0 THEN
  IF Time >= 93000 AND Time <= 150000 THEN // short breakouts after 1500 are not profitable
   SELLSHORT PositionSize CONTRACT AT MARKET
   TradeCounterShort = TradeCounterShort + 1
  ENDIF
 ENDIF

 // close positions
 IF Time = SellTime THEN
   IF LONGONMARKET THEN
    SELL AT MARKET
   ENDIF
  IF SHORTONMARKET AND Time = SellTime THEN
   EXITSHORT AT MARKET
  ENDIF
 ENDIF

// stops and targets
SET STOP LOSS sl
SET TARGET PROFIT tp

ENDIF
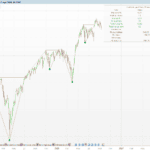
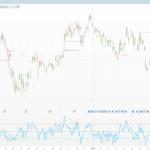
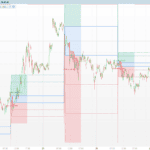
Comments
You must be logged in to post a comment.

Thank you for the clarifications Nicolas, I am more aware of the meaning of the backtesting now, after spending the weekend on it. Thank you for the amazing job of this forum.
how would you explain the fact that this robots stopped working pretty much at the exact period when it has been shared?
Is it just bad luck or it might be that sharing can affect negatively the profitability of an algorithm?
does anyone has thoughts about it?
Many thanks


tradex, open the settings dialog (click on wrench symbol) on the equity curve window and add a simple moving average indicator - thats all. When your backtest based on e.g. 100.000 candles set a period length of 2000 or 5000. Trade only if the equity curve is above of the average is an easy method to increase the profit probability


Hey. Been comparing the strategys performance versus the DAX volatility index. i've not done all 100 000 bars yet but so far the strategy is profitable when the $VDAX is somewhere between 15 & 25. Gonna work on this tonight and see if a can give you some kind of report.


Hi Reiner,
Can the code be changed to have a €2 per point risk/gain?
thanks

Please test it on demo first, as I'm not sure that plotting the MA on strategyprofit curve is working correctly with PRT-CFD. Work for sure with PRT software though. I'll ask PRT next week if it is possible now, because it were not the case when I wrote this article about this concept some weeks ago.

Hi Nicolas! Is it possible too reference the MA in the equity curve so as too know whether too put a trade on or not?
Hi Cosmic1,
Thanks for your feedback and sorry for the late answer. I only have 100.000 candles for backtest due that reason everything before 2015 is not clear for me. It works great since last May but has some drawdowns. But many things worked over the last month because of the volatility. I go with your picture that in 2014 this idea had troubles with the described parameters.
Best regards
Reiner
Hi Reiner,
Great bit of code, I will definitely by using some of it in my own strategies. With the times adjusted correctly for UK time and 1 point spread I get the following results. Does this seem correct?
http://s33.postimg.org/gmfw86o7v/image.png
http://s33.postimg.org/obhsh0v17/image.png

Hello Reiner,
Thanks for this nice code, as usual !
I've tested it in M15, on the DAX (I like M15 because there is sufficient historic data).
Without spread, it's winning since late 2014
With 1 point spread, it's loosing all money if we begin the test in 2008.
Did I miss something ?
Your strategy is good and we could do something to improve it.
Best regards,
Hey Reiner. Been reading and testing the code tonight. I just wonder you have put ONCE in the beginning of every line on the money management
// money management
ONCE Capital = 10000
ONCE Risk = 0.01
ONCE StopLoss = 10
ONCE equity = Capital + StrategyProfit
ONCE maxrisk = round(equity*Risk)
ONCEPositionSize = abs(round((maxrisk/StopLoss)/PointValue)*pipsize)
Hi Hockeygrader,
Thanks for your comment.
Yes of course, you have to remove some ONCE-statements if variable position sizing should be used:
equity = Capital + StrategyProfit
maxrisk = round(equity*Risk)
PositionSize = abs(round((maxrisk/StopLoss)/PointValue)*pipsize)
Sorry for the confusion.
best regards
Reiner

Hello Reiner
This looks very interesting and inspiring, thank you so much for sharing it with us and referring us to the concept here in the Blog.
Please would it be asking too much for you to include additional code to ... add to the equity curve a simple moving average so that the your above TS trades only if the equity curve is above the MA ... or would this be too much work for you please??
I am trying to do above myself, but not got it working so far.
Many Thanks
GraHal
Hi all, could a simple indicator be made to mark the traditional Pit based ORB? I'm trying to put together a similar indicator but struggling. I want to mark the NY Pit session (9:30 AM - 4:00 PM) each day for US500 with a vertical line and the opening 30 second range with a horizontal box. Could you or anyone help with this? Kind Regards