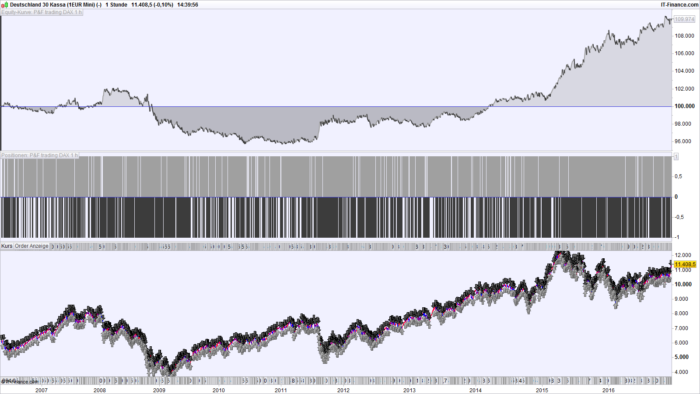
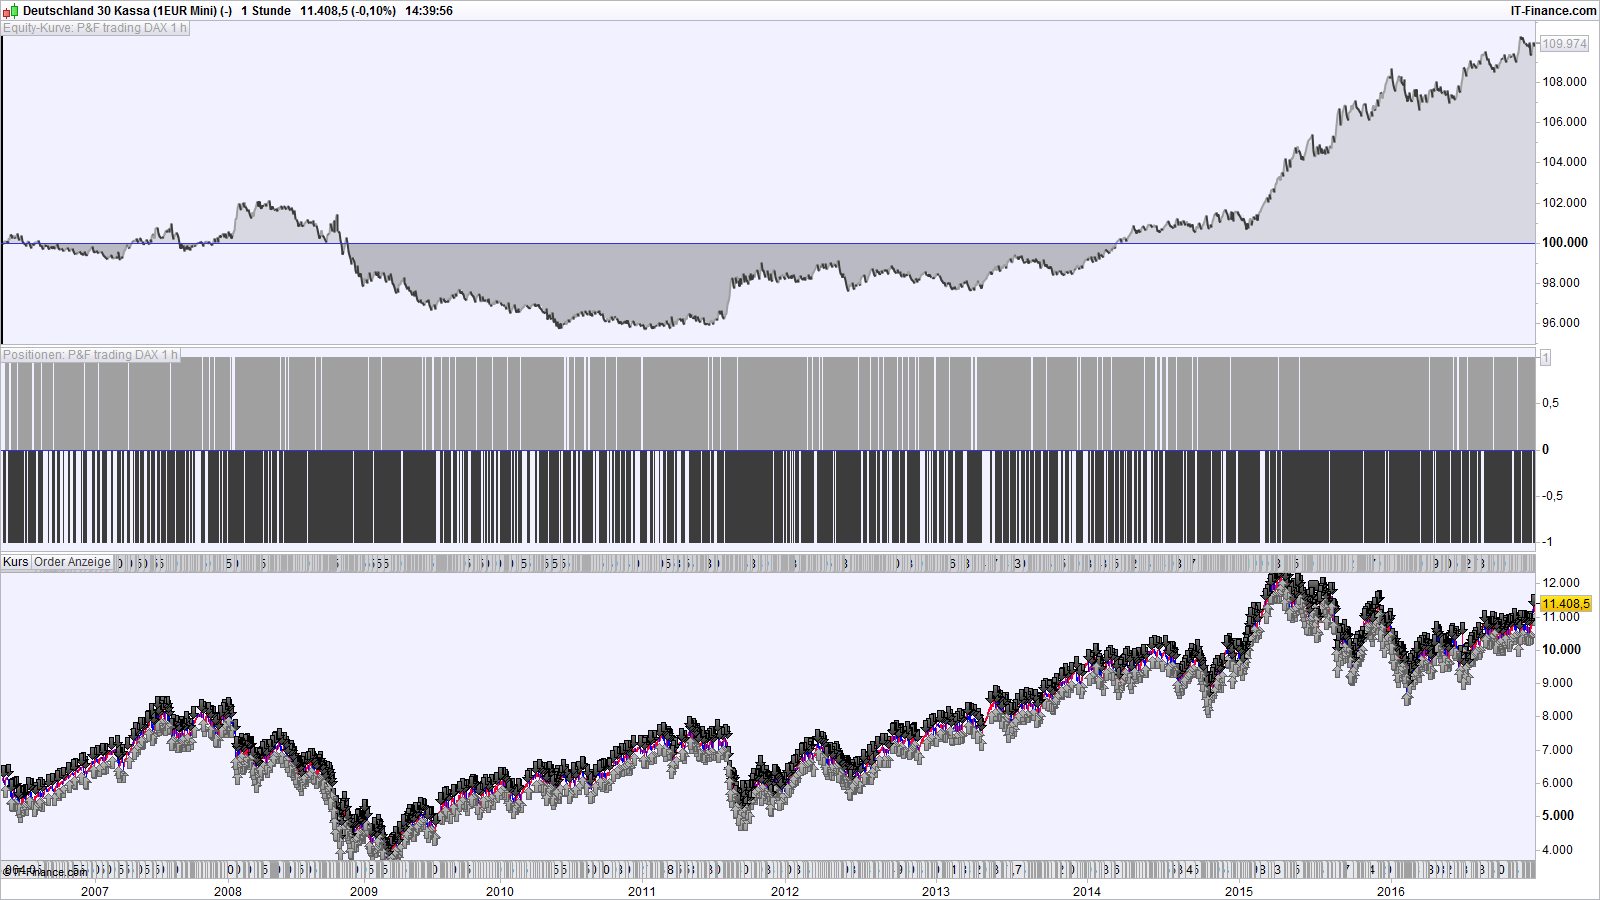
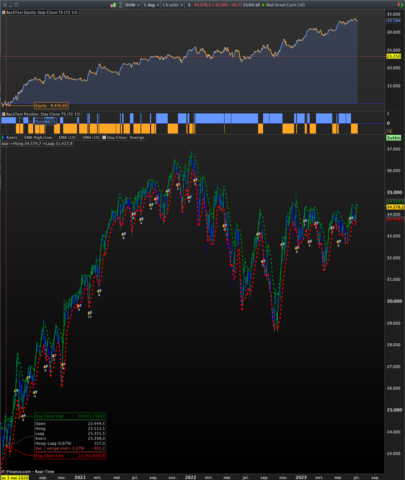
Here is a system that trades automatically point and figure charts.
The way it works :
All closing prices are sorted into boxes at the end of each bar – e.g. with a box size of 20 points, a close of 8247 will be in the box from 8240 to 8260.
The parameter “LowerBorderBox” is the lower end of this box. The upper end is LowerBorderBox + Boxsize.
When uptrend = 1 and downtrend = 0, there is an upward trend with long positions (XXXXX in P & F notation). When downtrend = 1, positions will be short (OOOOOO in P & F notation).
All boxes start at a value of 0 and their position is therefore fixed. For a box size of 20, we have boxes starting at a lower value of 0, 20, 40, 60, and so on. Or 8200, 8220, 8240, 8260…
The variable “UptrendHigh” defines the lower price of the highest box (X) of a current uptrend. The variable “DowntrenLow” defines the lower price of the lowest box (O) of a current downtrend.
The variable “turnafternn” sets after how many boxes in the opposite direction of the current trend, the trend direction is switched, e.g. from uptrend = 1 to downtrend = 1. Then, a buy or sellshort signal occurs.
For results identical to the point & figure charts built in ProRealTime, you have to set this threshold value to one unit higher than in the built-in charts. So, when we say that the P&F trend switches direction after 3 new boxes in the opposite direction in the built-in charts, we have to set turnafternn to a value of 4 in the automated trading system. I don’t know exactly why this is the case, but it appears that there is a difference in the definition of what a move of one box is. When we respect this difference, the point & figure charts are identical for the trading system and the built-in charts.
The results of point and figure trading are very much dependent on the box size. There is no single optimum value of the box size. As in Renko trading, results depend a lot on chance.
|
1 2 3 4 5 6 7 8 9 10 11 12 13 14 15 16 17 18 19 20 21 22 23 24 25 26 27 28 29 30 31 32 33 34 35 36 37 38 39 40 41 42 43 44 45 46 47 48 49 50 51 52 53 54 55 56 57 |
defparam cumulateorders = false ONCE uptrend = 1 ONCE downtrend = 1 n = 1 Boxsize = 20 turnafternn = 4 LowerBorderBox = round((close / Boxsize) - 0.5) * Boxsize ONCE DowntrendLow = LowerBorderBox ONCE UptrendHigh = LowerBorderBox If LowerBorderBox > LowerBorderBox[1] then If uptrend = 1 then downtrend = 0 ONCE DowntrendLow = LowerBorderBox If LowerBorderBox > UptrendHigh then UptrendHigh = LowerBorderBox endif endif If downtrend = 1 and LowerBorderBox >= DowntrendLow + (turnafternn * Boxsize) then UptrendHigh = LowerBorderBox uptrend = 1 downtrend = 0 endif elsif LowerBorderBox < LowerBorderBox[1] then If downtrend = 1 then uptrend = 0 ONCE UptrendHigh = LowerBorderBox If LowerBorderBox < DowntrendLow then DowntrendLow = LowerBorderBox endif endif If uptrend = 1 and LowerBorderBox <= UptrendHigh - (turnafternn * Boxsize) then DowntrendLow = LowerBorderBox uptrend = 0 downtrend = 1 endif endif If uptrend = 1 and uptrend[1] = 0 then buy n contracts at market endif If downtrend = 1 and downtrend[1] = 0 then sellshort n contracts at market endif set stop ploss 350 |
Share this
No information on this site is investment advice or a solicitation to buy or sell any financial instrument. Past performance is not indicative of future results. Trading may expose you to risk of loss greater than your deposits and is only suitable for experienced investors who have sufficient financial means to bear such risk.
ProRealTime ITF files and other attachments :PRC is also on YouTube, subscribe to our channel for exclusive content and tutorials




Interesting concept, good work !
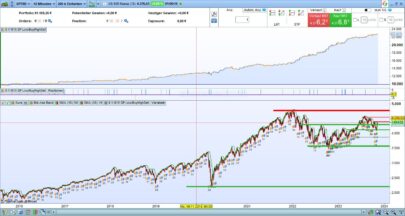
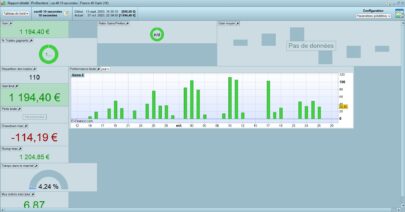
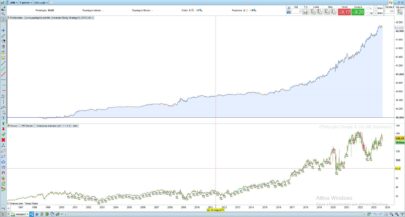
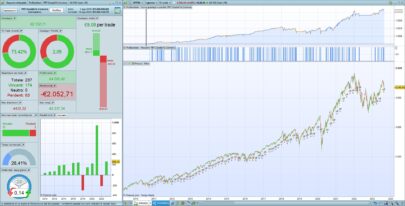
Thank you. This is mainly to show the concept, but I would not trade with this system as it is. Maybe someone can find additional criteria how to improve the performance, and, above all, the reliability and constancy of a point and figure trading system. The problem with such systems (point & figure, as well as Renko) is the fixed box size and box position over the whole chart. You can get good results with a box size of 35, for example, but losses for a box size of 36. Box size 37 may be good again. Let not fool yourselves by the optical appearance of point & figure charts (or Renko) !
Hi Verdi,
I like very much the point and figure tool and would like to work with your trading system but I tried it on shares (L’Oreal – OR) but it did not take position;
I changed of course the buy code lines; but nothing happened;
Do you have any idea and would you truy yourself on L’OREAL?
Best,
Chris