Hey there,
I like the ProRealCode community very much – so many ideas and solved problems!
Now, this is my first post of a strategy I developed long ago, when I still worked with MetaStock. Programming in Prorealtime is much more comfortable. Im not a master-programmer but I like to share my idea here:
The idea is that after a bearish phase the market makes it often the other way round and we can cut a little piece out of this “swing back”. But the swing back has to reach a certain level. I know this is a kind of Fibo-Trading, but I divided the downtrend with help of the donchian channel into 4 sections. The first section is the bottom, the second and the third are in the middle and the fourth is the top.
When the market crosses from the first to second section we go long. Target could be the level from second to third section. Sometimes you can risk more… This is the variable “zl” in the code.
In addition to the first signal the standard macd has to show an upwards trend.
Also I added a very, very light progression in it. I know – things like martingale always lead to a catastrophe. But I think at certain winning rate it can “help” a little bit – its a limited progression. The progression can also be sharpened or smoothed with the “ff”-variable.
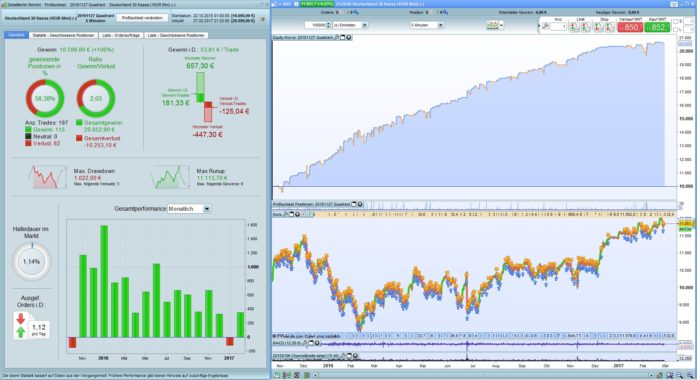
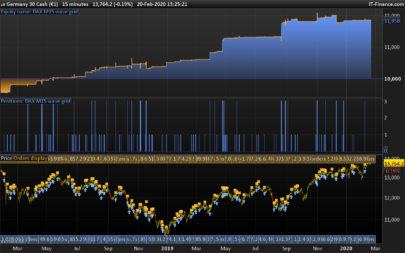
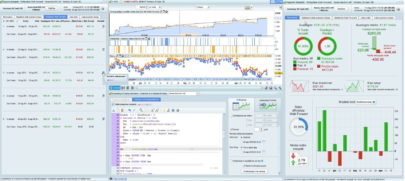
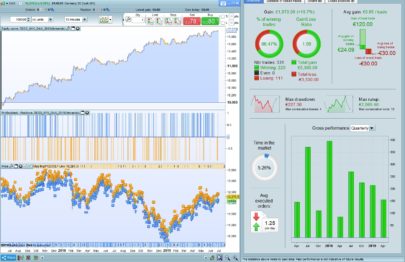
The starting ordersize “os” can be adapted to your account. An ordersize of 1 makes a drawdown of 293,- Euro, what is acceptable while gaining 3400,-. For me a draw down of 1/10 of the win is very acceptable. The maximum os is 7 in this case.
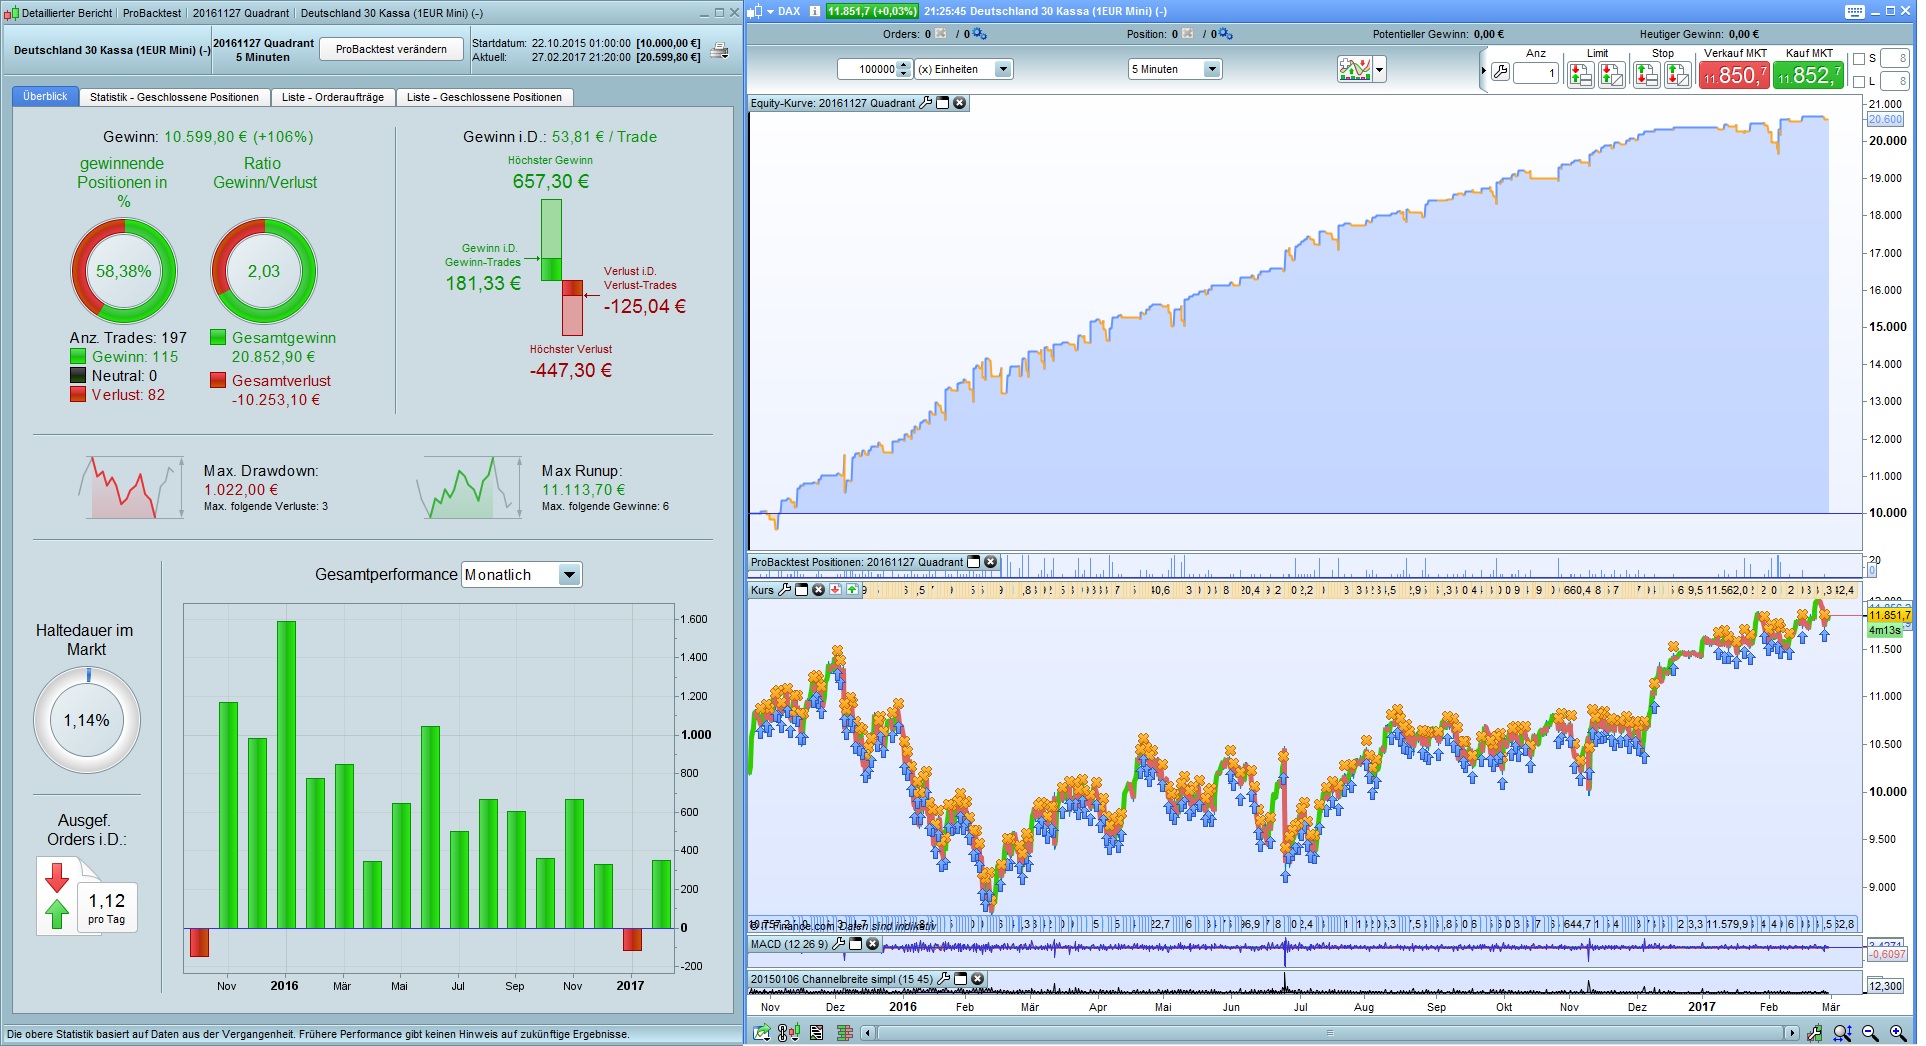
Increasing the ordersize to 3 makes a dd of 1022, while gaining 10600. Maximum os is 21.
Please feel free to change, prove and test the code….
Thanks for any responses….
Lotar
|
1 2 3 4 5 6 7 8 9 10 11 12 13 14 15 16 17 18 19 20 21 22 23 24 25 26 27 28 29 30 31 32 33 34 35 36 37 38 39 40 41 42 43 44 45 46 47 48 49 50 51 52 53 54 55 56 57 58 59 60 61 62 63 64 65 |
// Quadranten-System DAX 5 min // only long defparam flatbefore=090000 defparam flatafter=173000 once os=3 // ordersize - can be any number depending on account size. once osa=os once kax=15 //15 once teilung=1.5 //1.5 reducing the ordersize after winning trade once zl=2 // 2 Ziellevel. Quadrant wird in zl Teile geteilt, je weniger, desto höher das Ziel once mgr=60 // 40 Mindestgröße des Channels once ff=2.5 //2.5 increasing ordersize after losing trade. once maxcon=ff*ff*os+os// defing the maximum ordersize if hour=8 and minute>45 then // default setting of parameters outside tradingtime if strategyprofit>sp then // and if equity reaches maximum again. os=osa sp=strategyprofit endif start=0 endif if date<>20161226 and date <>20161227 and date<>20161230 and hour>8 then // there may be more "bad"-days to be excluded..... not only christmas if strategyprofit<strategyprofit[1] then // increasing ordersize when losing os=os*ff if os>maxcon then os=maxcon endif start=1 endif if strategyprofit>strategyprofit[1] then // decreasing ordersize when winning start=1 os=os/teilung if os<osa then os=osa endif endif ma= macd[12,26,9] // standard.... if not onmarket and start=0 then // defining the trading channel (Donchian) hh=highest[kax](high) ll=lowest[kax](low) diff=hh-ll // range of the channel elonglinie=ll[1]+diff/4 // defining the entryline by dividing the channel into 4 Quadrants. Entryline is the first line above the bottom // (above the lower band of donchian channel) ziellong=ll[1]+diff/zl // defining the target line. zl: a variable to play with..... elong=diff>mgr and close<elonglinie and ma[1]<ma// entry signal: minimum range of donchian, close below entry line and ///macd must move upwards. if elong then buy os contract at elonglinie stop // endif endif sell at ziellong limit // target sell at ll[1] stop // lower band of donchian = stop exit endif |
Share this
No information on this site is investment advice or a solicitation to buy or sell any financial instrument. Past performance is not indicative of future results. Trading may expose you to risk of loss greater than your deposits and is only suitable for experienced investors who have sufficient financial means to bear such risk.
ProRealTime ITF files and other attachments :PRC is also on YouTube, subscribe to our channel for exclusive content and tutorials

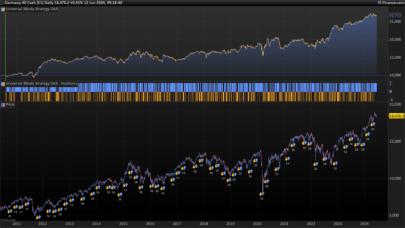
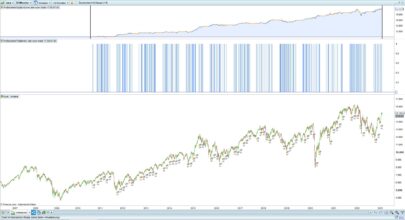
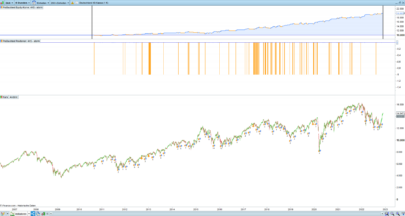
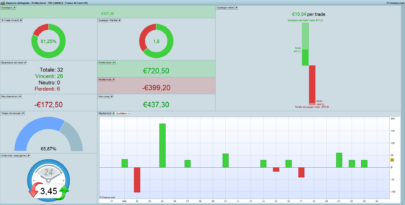
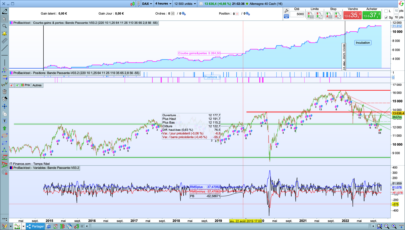
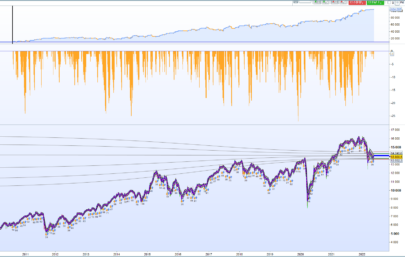
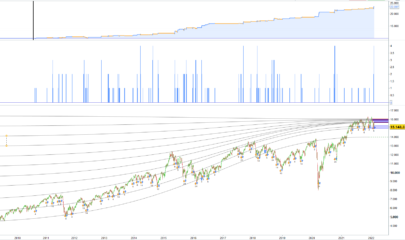
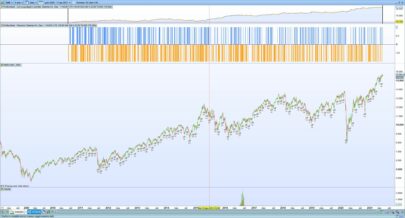
Hi Lotar, thanks a lot for your contribution and for your feedback about our website 🙂
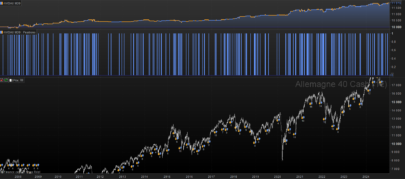
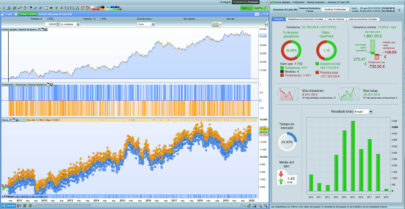
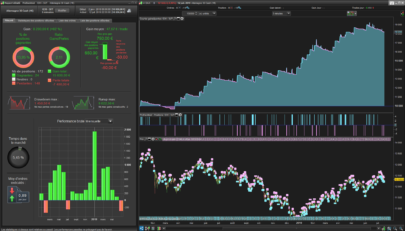
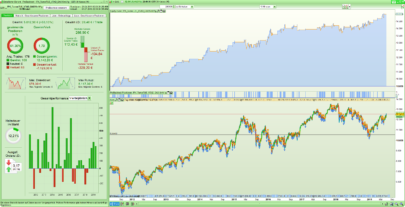
I’m filtering a lot what people are posting in the Library, that’s why you’ll find sometimes their posts directly in the forums instead of here. I must admit that this time I were wondering if this one should or not be part of it. The result of the strategy isn’t so good before 2016 ( https://a2a3f5h6.delivery.rocketcdn.me/wp-content/uploads/2017/02/quadrant-strategy-results.png ) But because the strategy is interesting and well coded and commented, I decide to make it features here instead for everyone’s benefit. I think you might find people to improve your ideas in the forums too, I’m looking forward for your next post 🙂 Thanks again.
Hello Nicolas,
thanks for your backtest. Unfortunately IG (at least my account) offers me only 100.000 units for backtesting 🙁
But – generally – I think that a strategy has to be adjusted regularly to the market. So: Does it make sense to backtest so far in the past? What I did is – and I got positive results – adjust variables every month. I backtested a timeframe of 5 months. I adjust the variables (in my case the “mgr” and the “zl” and the “ff”) depending on this backtest and then make a backtest for the next month.. and so forth. I think this is called “forward”-test !? I have to notice the results on paper. Besides – If this would be sometime an automatically feature of PRT – this would be unique I think! A window in PRT that asks: How long backtest? Which variables to take over in the forward-test (for exemple only best 3 results)? How long forward-test? And than just push a button and look at the results… maybe in one of the next updates?
Now I cant do this kind of (manually) forward-test back to 2013 because of my limited 100.000 units….
Regards
Lotar
A new feature for variables optimisation is already coming to IG users in a few weeks: the walk forward module. You can have a quick view here in the blog: https://www.prorealcode.com/blog/learning/strategy-optimisation-walk-analysis/
It will help users to their optimised variables in OOS (out of sample) periods, like forward-test, but in the past. This interesting tool will be valuable to avoid overfit.
Thanks for your code. A walk forward test would be much needed with a system like this. I´m a bit concerned with your “martingale” like money managment system. How does it perform without it?
Hi all, really love the community that is going on here, I am desperately trying to improve my coding so hopefully I will be contributing soon!
Just a question when I am backtesting my strategies, currently I have only been able to date back to 10,000 units, however many of the strategies I have seen on here go back much further. Is there a simple way I can solve this?
Cheers:)
You should have a look at the complete list of benefits you’ll get to be a PRT CFDs premium customer : https://trading.prorealtime.com/en/brokerage/cfd-forex-trading
Hi Benjamin – If you look at the chart window on the top there is a dropdown box which starts at 25 units all the way up to x years. If You then select (x) units a box will appear to the immediate left and then you can input the number of units in that box. If you have the Premium version of PRT you can get 200,000 units of data. If you have the standard PRT Complete version then you will have access to 100,000 units of data. Hope that helps.
Hi Lotar. Thanks for the code. I have gone through it line by line and I’m having trouble understanding this section:
if hour=8 and minute>45 then // default setting of parameters outside tradingtime
if strategyprofit>sp then // and if equity reaches maximum again.
os=osa
sp=strategyprofit
endif
start=0
endif
I’ve been thinking about it for a few days and I don’t think I can completely understand it. I also don’t really understand the difference in the code between os and osa. Please can you explain a little more for a beginner?
Many thanks in advance.
Hi Jonjon,
no problem!
Every morning between 8.45 and 8.59 the system checks if the strategyprofit hits the last high.
When you had a losing trade the os (ordersize) is increased. The system trades as long with the new ordersize (or even more – up the the set maximum) as it reaches its former high again.
Example:
You start with 1000 Euro. First order with 1 contract (os=1). You win. Now you have 1025 E (strategyprofit=25). Next order is a losing trade -10 E. Now equity is 1015 (strategyprofit=15). The variable “sp” is the memory of the highest strategyprofit (sp=25). After a losing trade ordersize is increased to 2. (os=2). Next trade is a winner – lets say +30. Now equity is 1045 (strategyproft=45). At 8.45 (out of trading time) the system noticed: strategyprofit is bigger than sp (45>25) –> A new high of the strategyprofit. No the ordersize is set to the beginning (osa). In this case osa=1 –> os=1. “osa” = ordersizeanfang (german: ordersize at the beginning). Also sp is set to 45 –> sp=45. The variable start is set to 0 “zero” – that means the system is allowed to trade again. After 1 trade the “start” is set to “1” to tell the system only to make 1 trade a day.
Hope I could help.
Regards
Lotar
Thanks Lotar for your time explaining this. In your example above I still don’t understand why sp = 25 and not sp = 45 (after you had the winner of +30)? Is sp calculated once per day?
Hi Lotar, vey nice ! I will try it thank you 😉
When i backtest the strategy it looks working well…
I try with The :
Dax 5€ 10 contract Max
capital 10 000€
Dax 1€ 5 contract Max
capital 1000 €
The question I have is How works the stop loss and the take profit ?
Because when I backtest with a capital of 1000€ and the Dax 25€ for exemple… It crash to – 52 000€… Is that min that we can lose more than what we have ?
@ Jonjon: First the strategyprofit has to be higher than sp. After that sp is set to the new level… yes its checked once a day.
@ François: I only tested this strategy with the Dax 1 Euro Mini. I would not run it with the “normal” Dax (1 Point = 25€).
Hello,Your strategy is amazing, thanks for sharing.Is it possible to make the same code for short positions? If so, could you tell me the code?Thank you in advance.
Hi Plop61,
thanks for your comment.
To make the code for short positions is possible. But its difficult because you have flip the Quadrants. But I am working on that.
Another thing I am workin on is to test/ transform the code with/to other time scales…
Regards
Lotar
Hi Lotar,
your strategy raised my interest; I did some tests and made a few adjustments fit for my own situation;
above all I did not change your main idea of using Donchian and the macd; I made some other changes and additions, to serve the following two purposes:
raising the % of winning trades from the 50%- to the 80%-zone; then the strategy is less of a tossing and more of a real strategy;
raising the profit/loss-ratio
reducing the drawdown
I commented my adjustments inside the the strategy.
1. I adjusted the os; your strategy has positions like 2.66; since I use cfd’s at IG, my position should always be an integer; then I allowed os to be either 1 or 2;
2. I added another indicator for the trend: the MA based on HULL;
3. I limited the length of the trade to 29 bars, to prevent going overnight; moreover: the longer the trades, the bigger the chance of losing;
Based on 100.000 units my strategy has 126 trades, yours 176; but I guess that 126 is still statistically significant. I used WFA to optimize. My system has less total gain, but with 85% winning trades and a p/l ratio of 2.51 in combination with a much smaller os there is a considerable reduction of loss. I have to admit that your system makes big gains, however I would not yet be prepared to pay such great losses for that.
A final note on WFA: it’s not only useful against curvefitting, but also a method to converge a parametervalue. I already apply WFA manually for some years: I optimize on a certain period and then test the strategy on the adjacent out-of-sample period. Hoping that my parameters in the end converge to certain stable, profitable values. However, the basis remains that one knows how to optimize, and that one knows which parameter influences which result. I always optimize by analyzing the data in excel charts.
Well, I will check how this strategy works in April, then optimize and see how the new version works in May and so on; the goal being that the differences between two version eventually get smaller.
I think you did a great job. I hope you will consider to make a short strategy, it would be my pleasure to elaborate that one. It would also be nice to make an indicator that belongs specifically to this strategy, so that we can study why certain trades go wrong…
All the best, Jerke vd Geest
Netherlands
Here is the link to download my version of the strategy: https://www.prorealcode.com/wp-content/uploads/2017/04/Quadrant-2.0-DAX-5-min.itf
You can send it to contact@prorealcode.com and I’ll attach it here. Thanks for your sharing!
Hi Lotar, which variables would you choose to recalibrate it to the present market conditions?
Thanks!!
unfortunatly in today’s market it’s not working at all…