Dear all, I have been listening to a class by Rob Hofmann yesterday and I though it was worth try to code it.
The strategy is based on the follwoing principles
- Bearmarket->bullish hammer candle (signal candle) -> sell stop order somewhere along the signal candle
- Bullmarket-> bearish hammer candle > buy stop order somewhere along the candle.
Should be applicable to many assets and many timeframes.
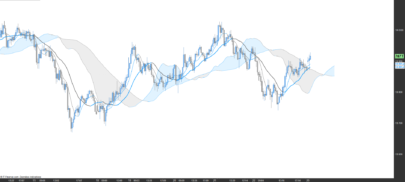
I post the example of OIL 1hr TF.
Looking forward for your comments
Best
Francesco
|
1 2 3 4 5 6 7 8 9 10 11 12 13 14 15 16 17 18 19 20 21 22 23 24 25 26 27 28 29 30 31 32 33 34 35 36 37 38 39 40 41 42 43 44 45 46 47 48 49 50 51 52 53 54 55 56 57 58 59 60 61 62 63 64 65 66 67 |
///Rob Hoffman idea of trend following mechanism //crude oil 1hr spread 1 DEFPARAM cumulateorders = FALSE ///indicators used to define market trend average1 = average[5](close) average2 = average[20](close) average3 = average[50](close) average4 = average[100](close) atr = averagetruerange[14] ///optimized variable ml = 9// dynamic factors for profit and stops nl = 4 ms = 6 ns = 4 c = 2.8// factor used to calibrate the shape of the hammer candle used as a signal gradient = 1 // slope of moving averages ////defining the bull trend conditions bulltrend1 = average1-average1[2] >gradient and average1< close bulltrend2 = average1-average2[2] >gradient and average2< close bulltrend3 = average3-average3[2] >gradient and average3< close bulltrend4 = average4-average4[2] >gradient and average4 < close bulltrend = bulltrend1 and bulltrend2 and bulltrend3 and bulltrend4 /////defining the bear trend conditions beartrend1 = average1-average1[2] <-gradient and close < average1 beartrend2 = average1-average2[2] <-gradient and close < average2 beartrend3 = average3-average3[2] <-gradient and close < average3 beartrend4 = average4-average4[2] <-gradient and close < average4 beartrend = beartrend1 and beartrend2 and beartrend3 and beartrend4 ///defining the signal candles hammerup = abs(open-close)< (High - low)/2 and close> high -(high-low)/c and open > high - (high-low)/c // hammerdown = abs(open-close)< (High - low)/2 and close< low +(high-low)/c and open < low + (high-low)/c // ///defining the level for the stop orders if hammerdown and bulltrend then levelup = high-(high-low)/2 endif if hammerup and beartrend then leveldown =low + (high-low)/2 endif ///trading conditions if bulltrend then buy 1 contract at levelup stop endif if beartrend then sellshort 1 contract at leveldown stop endif ///dynamic profit and stops if longonmarket then set target pprofit ml*atr set stop ploss nl*atr endif if shortonmarket then set target pprofit ms*atr set stop ploss ns*atr endif |
Share this
No information on this site is investment advice or a solicitation to buy or sell any financial instrument. Past performance is not indicative of future results. Trading may expose you to risk of loss greater than your deposits and is only suitable for experienced investors who have sufficient financial means to bear such risk.
ProRealTime ITF files and other attachments :PRC is also on YouTube, subscribe to our channel for exclusive content and tutorials
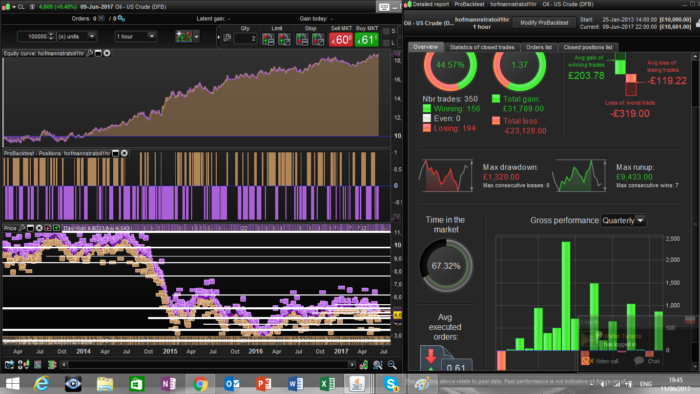

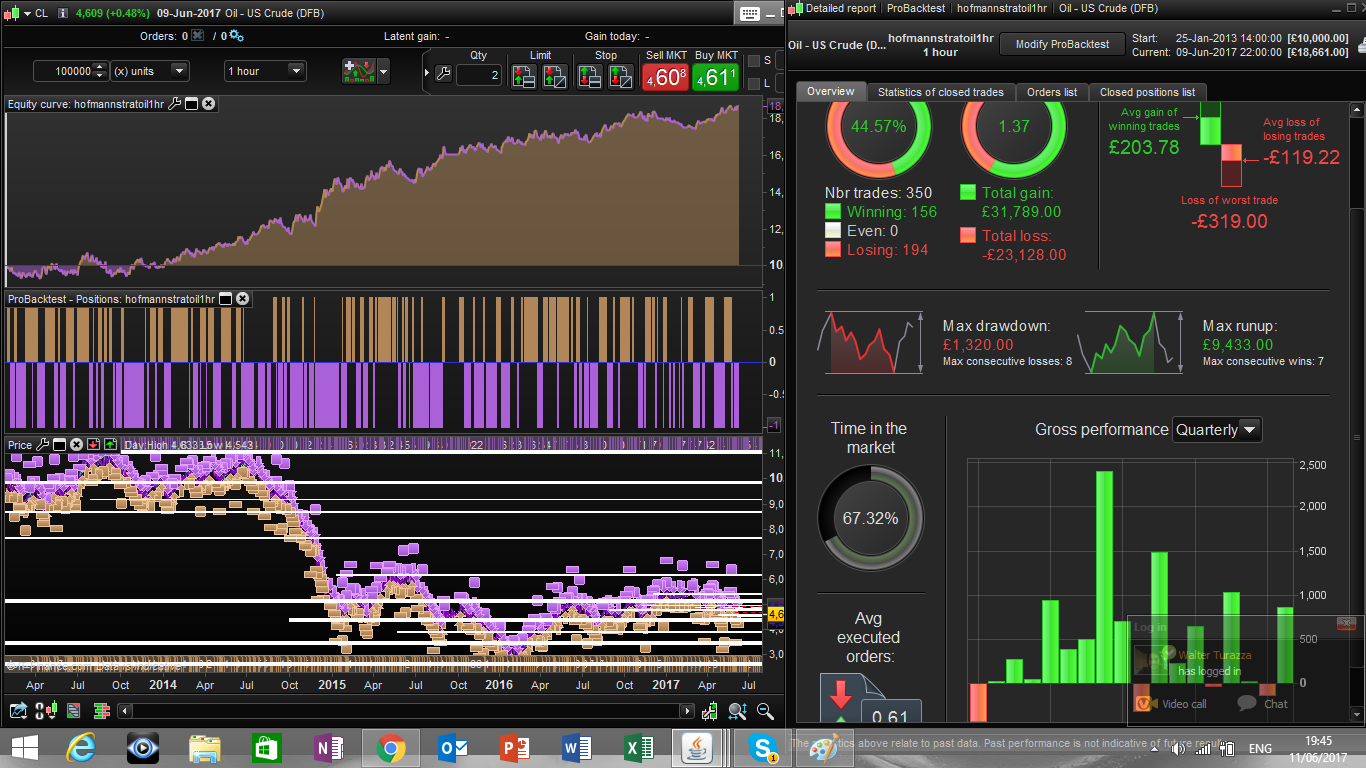

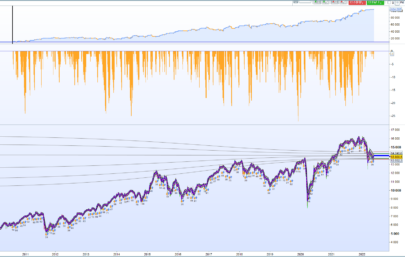
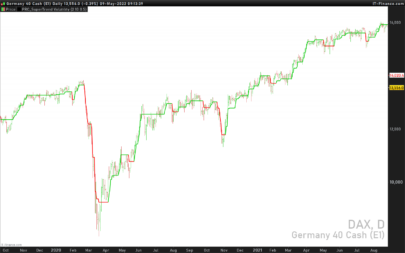
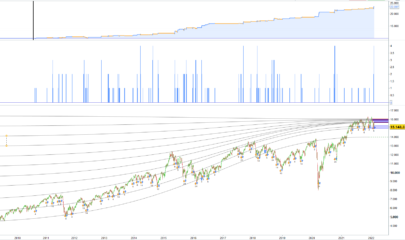
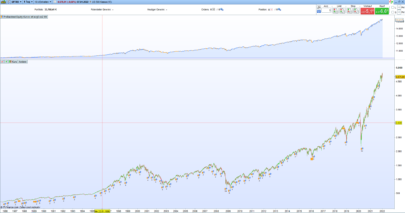


This strategy was posted 2 years ago. I tested it today and it works perfect with the new data. I think it deserves attention!
Hallo
I am not able to use it on daily TF
What have I to change?
Thanks a lot
Ciao Francesco, ti scrivo per un aiuto a proposito della strategia di Hofmann che anch’io ho conosciuto tempo fa. Ho visto che su Oil funziona bene anche se non sono riuscito ad impostarlo con lotto 0.1 (come permette di fare IG). POi ho notato che ci sono molti stop e pensavo di trovare il modo di ottimizzarlo. Ma il problema che non riesco a risolvere riguarda gli altri strumenti (forex ad azionario) perchè quando lancio il backtest non mi da operazioni. Credo che sia un problema legato alla parte al “gradient”.Potresti suggerirmi cosa modificare nel codice per farlo funzionare su azionario e forex. Grazie Rosario