Hello,
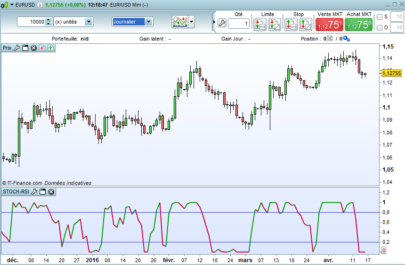
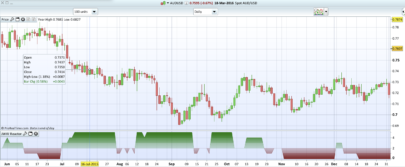
Here is a strategy idea for GBPUSD H1.
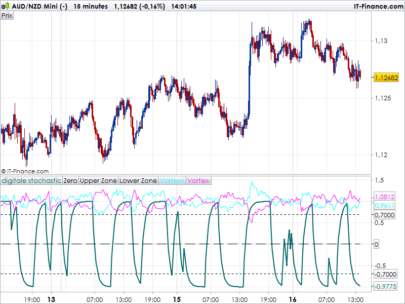
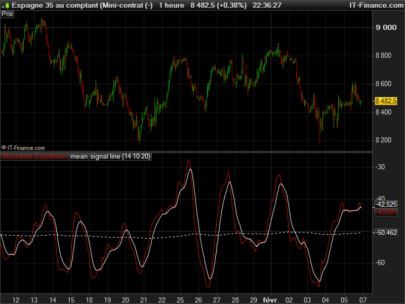
- Stochastic showing momentum down/up
- RSI up/down (over 55 or under 45)
- SMA crossover for SMA10 and SMA5
- Stochastic not yet oversold (still over 55) or not yet overbought (still under 45)
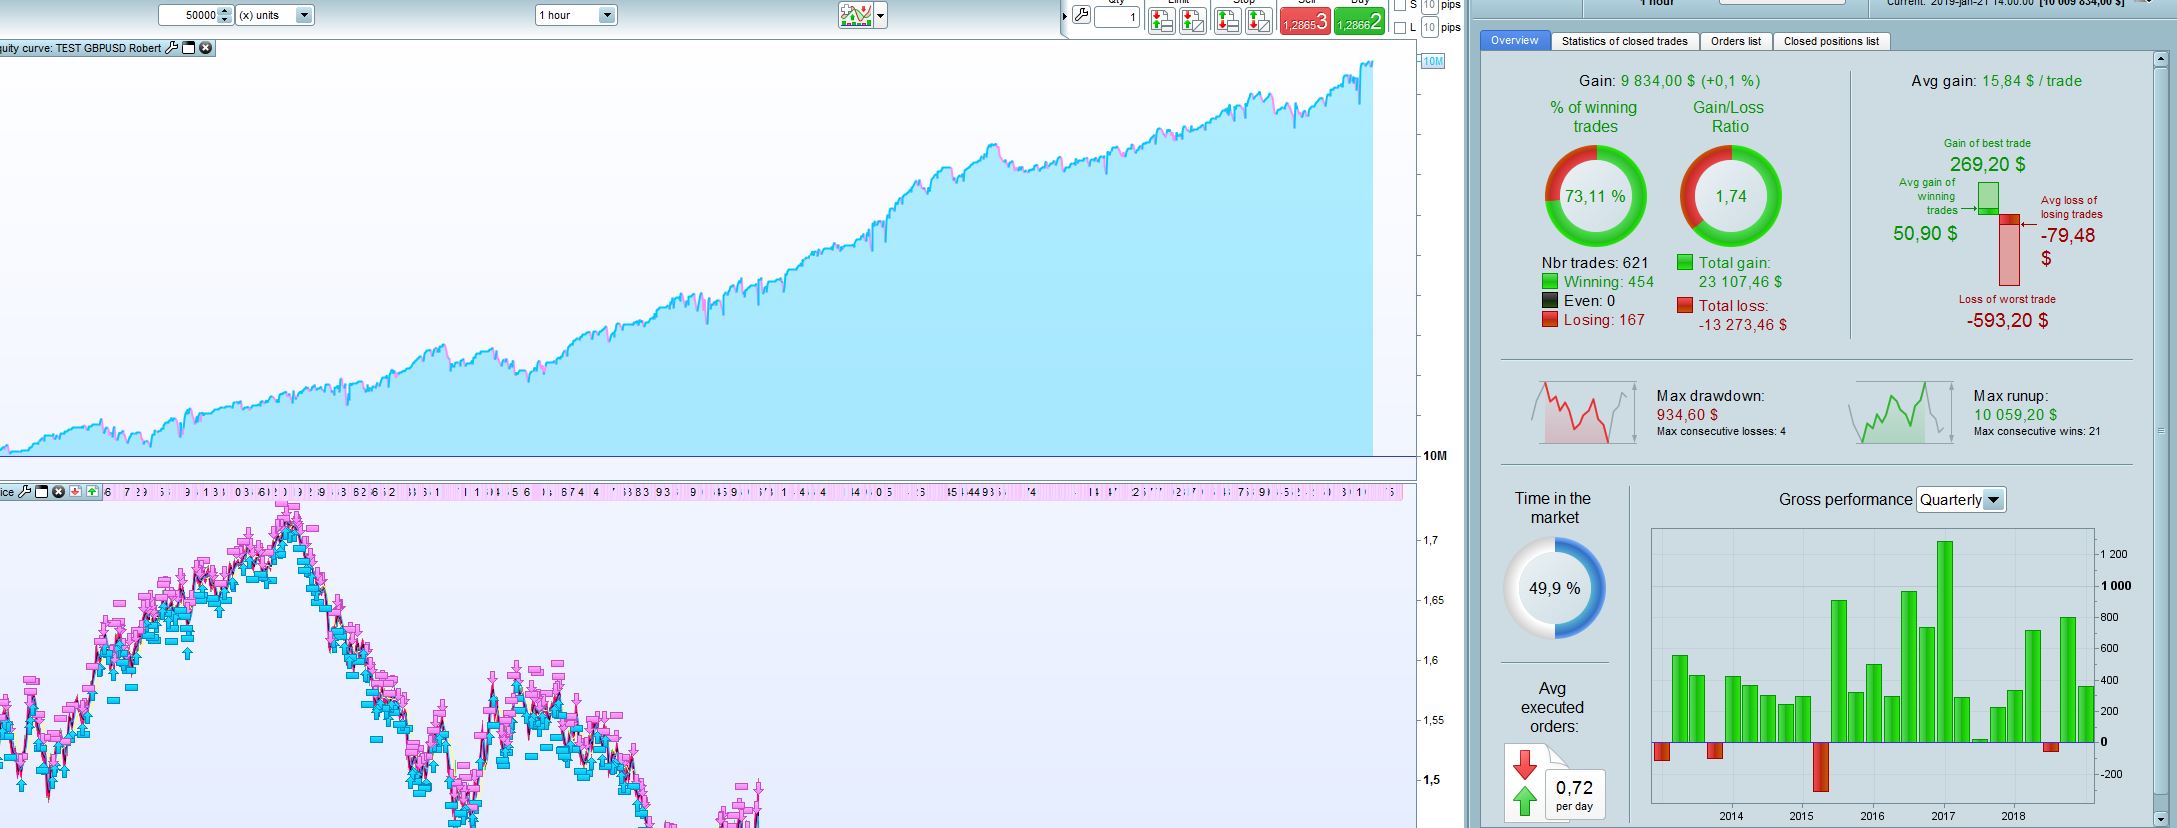
Strategy was originally optimized IS for 2014-2017 and showed good result for 2013 – 2019. Years before that the result are not so good. Note that SL is set to 1000, which in reality means there is no SL until a new order is triggered in the opposite direction or the order meets its TP. Any ideas of improvement or tips, please share 🙂
|
1 2 3 4 5 6 7 8 9 10 11 12 13 14 15 16 17 18 19 20 21 22 23 24 25 26 27 28 29 30 31 32 33 34 35 36 37 38 |
//GBPUSD STOCH RSI SMA Lose DEFPARAM CumulateOrders = true// tradestart = time > 090000 Tradeend= time < 210000 TP =50 SL =1000 SMA5 = Average[5](close) SMA10 = Average[10](close) STOCH = Stochastic[14,3](close) indicator4 = Average[5](STOCH) RSIind = RSI[14](close) // Conditions to enter long positions c1 = (SMA5 CROSSES OVER SMA10) c2 = (STOCH - indicator4 >10)//Stochastic upward momentum c3 = (RSIind > 45)//RSI upward momentum c5 = (average[10](STOCH)<45)// Stochastic not yet overbought //Conditions to enter short d1 = (SMA5 CROSSES UNDER SMA10) d2 = (STOCH - indicator4 <-10)//Stochastic downward momentum d3 = (RSIind < 55)//RSI downward momentum d5 = (average[10](STOCH)>55)//Stochastic not yet oversold IF c1 AND c2 AND c3 AND c5 AND tradestart AND tradeend THEN BUY 1 CONTRACT AT MARKET Set target pprofit TP SET STOP pLOSS SL ENDIF IF d1 AND d2 AND d3 AND d5 AND tradestart AND tradeend THEN SELLshort 1 CONTRACT AT MARKET Set target pprofit TP SET STOP pLOSS SL ENDIF |
Share this
No information on this site is investment advice or a solicitation to buy or sell any financial instrument. Past performance is not indicative of future results. Trading may expose you to risk of loss greater than your deposits and is only suitable for experienced investors who have sufficient financial means to bear such risk.
ProRealTime ITF files and other attachments :
Find other exclusive trading pro-tools on ![]()
PRC is also on YouTube, subscribe to our channel for exclusive content and tutorials


Beautiful thank you!
Nice one. Not trading every day makes a difference and improve results per trade substantially. Still has to run a SL like 2% and a smaller PT but curve looks great! Did not optimize the indicators.
Thank you Paul,
Do you mean no trades during specific dayofweek and 2% from marketprice as SL?
great ! can you add stop lost to improve ?
Thanks Alekos,
As I mentioned the Stop Loss is set to 1000. You can test different settings or maybe you can find a better kind of SL than pips.
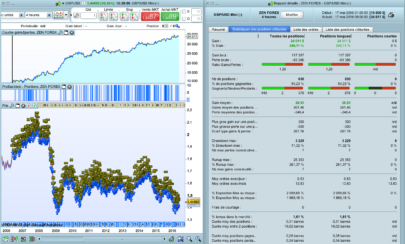
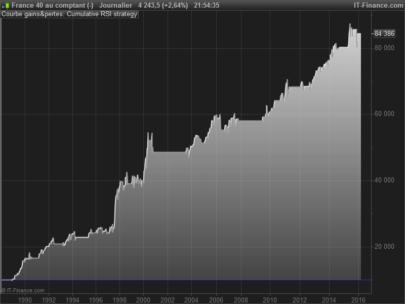
Checked it on 200K bar test for GBPYUSD and it looks like a typically curvefit/overoptimized algo from 1999 – 2008~ meaning its flat and in the red.. then from 2008 -> today it looks great and amazing. So thats a red flag for sure.
Another red flag is that it dosnt rly look good for any other market.. forex, stocks, indicies.. thats a red flag.
Dosnt mean this wont work moving forward, but i would definitly be very carefull using this for live money.
Thank you for your reply jebus,
1. As I said, earlier years arent so good, could be a problem.
2. My opinion is that a strategy doesnt have to work on other markets. Its surely promising if it does but its not a absolute requirement for me. I have seen strategies working good on only DAX or FTSE for ex.
I know its an endless discussion regarding what requirements to set on a strategy before going live, but its also one of the most important questions for us, so thank you for jebus for sharing your toughts on this one. It would be so easy if there was an easy answer for this quesion 🙂
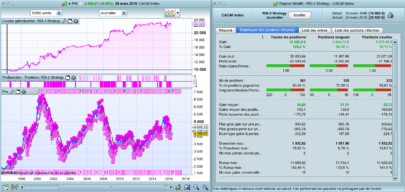
Optimized the days in a week and it seemed that Tuesday and Friday are not good days to trade.
I set cumulate orders to false to compare.
Try 75k bars (from 2007), stoploss 2%-3% from entry-price, profit-target 0.40% and exclude those days, with only 1 trade long or short a day.
I only optimize days to see how a strategy performs in generally and if it’s in balance.
What I don’t like about the strategy is that i’am unable to build a useful breakeven- or trailing-stop in the strategy that works.
Thanks Paul for the tips about testing balance.
I am actually struggeling with breakeven or trailing stops an all my strategies. I never get it to be more profitable than my normal SL. 🙁
Hello.
Is the Strategy running live with any of you? Are there any results? Are there any deviations Backtest, Demo, Real?
kind regards
Hi Bluetime,
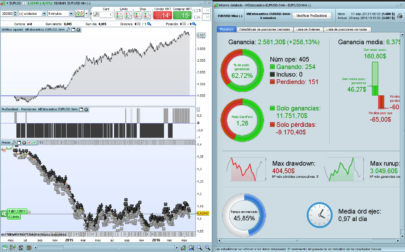
I have been running this on a Demo since February. The results still within the same range as previous backtest. The % of winning trades are 72%. There was a drawdown in January, but nothing that stood out from earlier backtest. I would like to wait a bit longer in demo to confirm this one, but so far so good 🙂
As said earlier the 200K backtest shows a really bumpy ride until 2008 or even to 2012 depending on how you look at it. That is a warning sign for sure, but I did my optimisation 2014-2017 and left the rest as Out of sample period. So there is some OOS time that shows good results. I like the fact that the period from 2018 and forward is looking good as I did no optimisation in that period.
I hope that helps.
I took the chance of running it live with some optimizations/modifications since 23 april and winrate is 78.5% , G/L ratio is 2.88 on 14 trades. So far so good! Also started on EURCAD and USDPY this month but will have to report on those later since they’ve only taken a couple of trades.
Hi Gubben,
It would be interesting to know what changes you have done and also your backtest results.
@PastaPesto, for GBP USD mainly inspired by Paul it was 2% stoploss and 45 take profit, also no trades on fridays and maxorders per day is 2. Since april it has 84% winning trades and 4.18 Gain/loss.
The other currency pairs are performing awful so far 😀 but it could be within the scope of a drawdown looking at the backtests. It hurts to look at but will let them go on for a while longer otherwise there is no point in running a live “test”.
@PastaPesto just writing to update that this strategy still has 84% winning trades and an even higher gain/loss in demo, although IG force-shut all my demo account so there was no trading january-end of april. Really good since may. I have run it live a bit but not as much as in demo. Going to start it up live now again. Are you running it live?
Hi Gubben, Nice to hear that you are using this one and that its doing fine. Yes I have been running this live in three different versions since I posted. One version is the same as the one I posted and the other ones are filtered by EMA and by a big candle in the right direction. The filtered ones have a winrate of over 90% but they take positions only about once/month. All of them where developed at the same time but I only posted one. They have all been doing very well, although now I recently have turned them off as I have reduced my trading account. When running all three the potential total drawdown is quite high even with the smallest size so from now I will only run the original version, and as you said its been doing great the past three months :). My choice to run the original is also because I never make changes to any strategy after I test it on out of sample period, unless I will let it run on demo for a longer time. Thanks for your update Gubben, I hope this one keeps bringning us money 🙂
When an automatic trade goes against you this much as it has this week (given that your version is also in a losing position now) Do you usually let it run and trust the long term statistics or do you close manually? Always a tough decision for me since the whole position of me running automatic is that my discretionary track record is awful compared to bots.
I personally never do anything with my bots when their in position. I know some people do, but I never do that. I turn bots off when I think it has lost its edge over the long turn. I try to trust them, but I only run bots that have been doing well in out of sample period or in demo for some time. I actually posted a questions about turning off bots, and answers varies. For me I have a rule of turning bots off when they go lower than their worst drawdown in backtest or if the winrate goes down a lot. But thats me, Im not a pro ;). As mentioned before I turned all the bots for the above strategy off recently because I reduced my account size (the Drawdown for this strategy 2017-2020 is about 1000USD), but the original will be turned on again soon. This strategy is not in a drawdown though, take the code above and test it in BGPUSD 1H, it actually made a profit today and is not in a position. Please let me know if you have any other result.
It’s probably my version then. And it can take cumulative trades, so it took another win now, and the first one has actually recovered most of the loss. 🙂
super this what I was looking for from Monday I will put this in real time to see what can do))Many thanks .
//eurusd STOCH RSI SMA Lose
DEFPARAM CumulateOrders = true//
tradestart = time > 090000
Tradeend= time 10)//Stochastic upward momentum
c3 = (RSIind > 30)//RSI upward momentum
c5 = (average[6](STOCH)<50)// Stochastic not yet overbought
//Conditions to enter short
d1 = (SMA5 CROSSES UNDER SMA10)
d2 = (STOCH – indicator4 <-10)//Stochastic downward momentum
d3 = (RSIind 52)//Stochastic not yet oversold
IF c1 AND c2 AND c3 AND c5 AND tradestart AND tradeend THEN
BUY 1 CONTRACT AT MARKET
Set target pprofit TP
SET STOP pLOSS SL
ENDIF
IF d1 AND d2 AND d3 AND d5 AND tradestart AND tradeend THEN
SELLshort 1 CONTRACT AT MARKET
Set target pprofit TP
SET STOP pLOSS SL
ENDIF
i have test it from 22-okt-2015 to 24-jan-2020. look out for the MAE ferry high up to -$5249,00 on the 4 hours map
dearno it hasnt made any money from sep 2018 though
how did you backtest it ?
@AntoGH , I dont know if you are asking me, but my backtest was made in an IS of 4 years between 2014 and 2017. The rest is out of sample. I hope that answers your question.
@PastaPesto Do you still running this and how is the results?
Thanks