

Sell in May, Buy in October : it works!
Hi all !
We will check the well-known adage traded “Sell in May , Buy in October .”
So I decided to code the strategy and check on various indices.
You will be surprised at the results!
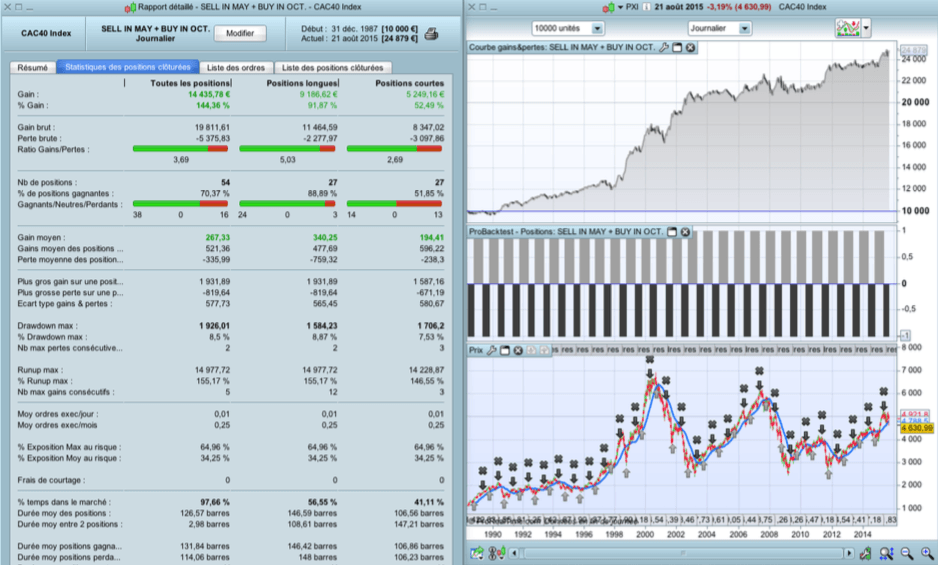
For example, the CAC40 : from 31/12/1987 to 21/08/2015 (my backtest data when I had realized the test) we have 70% winning trades, with higher earnings than average losses and a profit factor of 3.69.
And if you separate long and short positions, positions “long” only give 88.89 % success rate, with a profit factor of 5.03 !
You can check the strategy is clearly winning over as many indexes : DAX30, FTSE, S&P500, NIKKEI, NASDAQ Composite, Dow Jones.
So I give you the code of the backtest (excerpt from one of my e-books), you can test and verify for yourself.
Best Regards,
Marc (from France)
DEFPARAM CumulateOrders = False

IF currentmonth = 10 THEN
 BUY 1 shares at market
ENDIF

IF currentmonth = 5 THEN
 SELL at market
ENDIF

IF currentmonth = 5 THEN
 SELLSHORT 1 shares at market
ENDIF
IF currentmonth = 10 THEN
 EXITSHORT at market
ENDIF