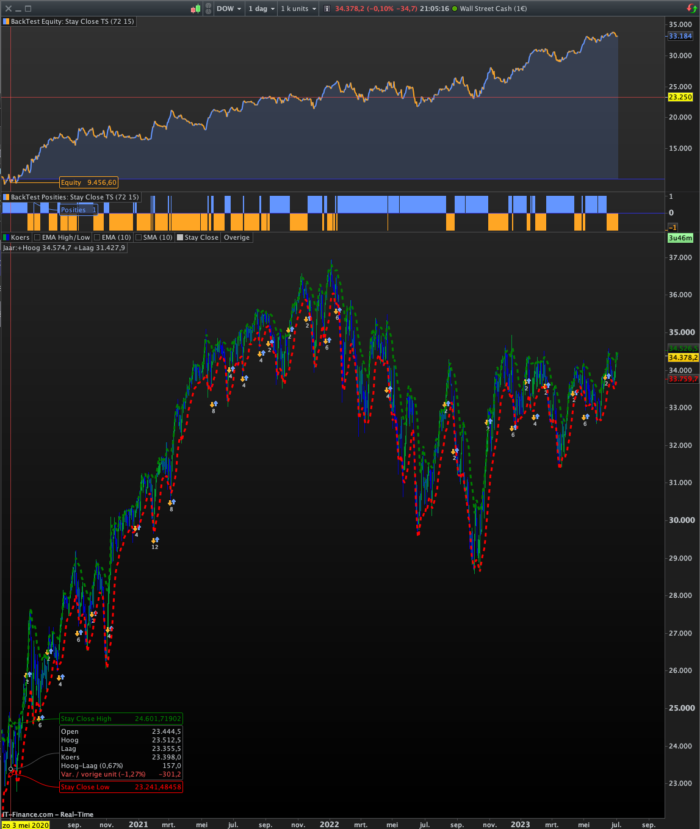
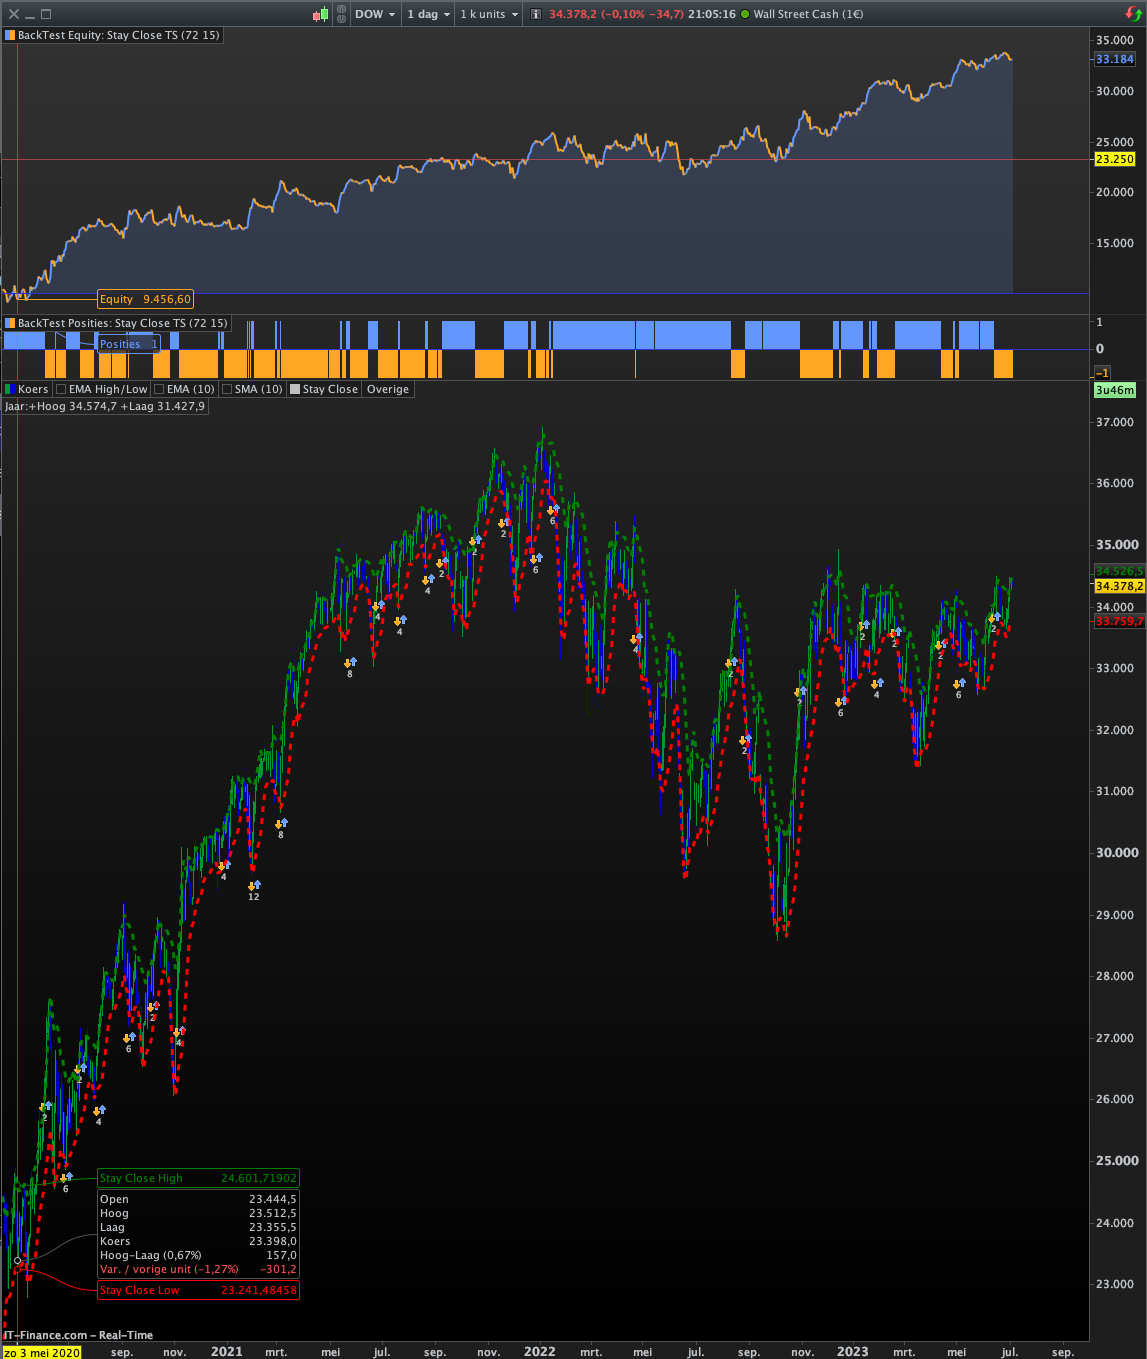
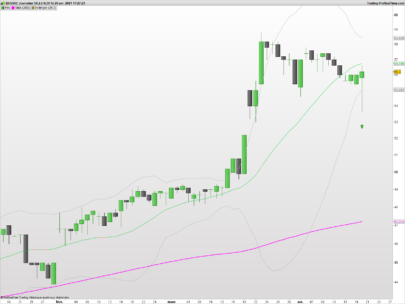
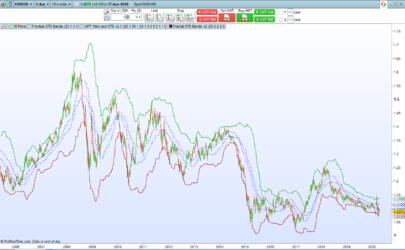
As every trader knows, the Bollinger Band is made up of an average plus/minus the standard deviation. This is a strong concept on which many variations can be made. This variation uses an exponential average based on the “High” plus one standard deviation based also on the “High” and an exponential average based on the “Low” minus one standard deviation also based on the “Low”.
In this variation, the trading system works better as a “Countertrend System” than as a “Trend Following System”. The two parameters, “PeriodHigh” and “PeriodLow”, can be optimized for use in certain stocks, indices, Forex, …
|
1 2 3 4 5 6 7 8 9 10 11 12 |
DefParam CumulateOrders=False SCH=ExponentialAverage[PeriodHigh](High)+Std[PeriodHigh](High) SCL=ExponentialAverage[PeriodLow](Low)-Std[PeriodLow](Low) If High > SCH then SellShort 1 contract at Market EndIf If Low < SCL then Buy 1 contract at Market EndIf |
Share this
No information on this site is investment advice or a solicitation to buy or sell any financial instrument. Past performance is not indicative of future results. Trading may expose you to risk of loss greater than your deposits and is only suitable for experienced investors who have sufficient financial means to bear such risk.
ProRealTime ITF files and other attachments :PRC is also on YouTube, subscribe to our channel for exclusive content and tutorials







Hello, very interesting. Do you have already some tested condiction including timeframe and asset that according to simulation is performing at best?