Hello everybody! I post here a strategy that I am using with real money.
It uses trend direction (slope) of the 20 periods moving average and the price momentum.
Orders are then triggered once the RSI 20 periods enter in overbought and oversold areas.
Tested with 100k bars: if someone could test it with 200k bars and let me then know the result, this would be many appreciated!!
Best regards.
H.
|
1 2 3 4 5 6 7 8 9 10 11 12 13 14 15 16 17 18 19 20 21 22 23 24 25 26 27 28 29 30 31 32 33 34 35 36 37 38 |
// Definizione dei parametri del codice DEFPARAM CumulateOrders = False // Posizioni cumulate disattivate DEFPARAM FLATBEFORE = 090000 DEFPARAM FLATafter = 175500 indicator1 = RSI[20](close) c1 = (indicator1 CROSSES OVER 70) c8=close>average[20] c65=Momentum[12]>momentum[12][1] c66=momentum[12][1]>momentum[12][2] IF c8 and c1 and c65 and c66 THEN BUY 2 CONTRACT AT MARKET ENDIF indicator2 = RSI[20](close) c2 = (indicator2 CROSSES UNDER 60) c13= average[20]<average[20][1] IF c2 or c13 THEN SELL AT MARKET ENDIF indicator3 = RSI[20](close) c3 = (indicator3 CROSSES UNDER 30) c34=close<average[20] c65=Momentum[12]<momentum[12][1] c66=momentum[12][1]<momentum[12][2] IF c3 and c34 and c65 and c66 THEN SELLSHORT 2 CONTRACT AT MARKET ENDIF indicator5 = RSI[20](close) c5 = (indicator5 CROSSES OVER 40) c13= average[20]>average[20][1] IF c5 or c13 THEN EXITSHORT AT MARKET ENDIF SET STOP pLOSS 40 SET TARGET pPROFIT 40 |
Share this
No information on this site is investment advice or a solicitation to buy or sell any financial instrument. Past performance is not indicative of future results. Trading may expose you to risk of loss greater than your deposits and is only suitable for experienced investors who have sufficient financial means to bear such risk.
ProRealTime ITF files and other attachments :PRC is also on YouTube, subscribe to our channel for exclusive content and tutorials
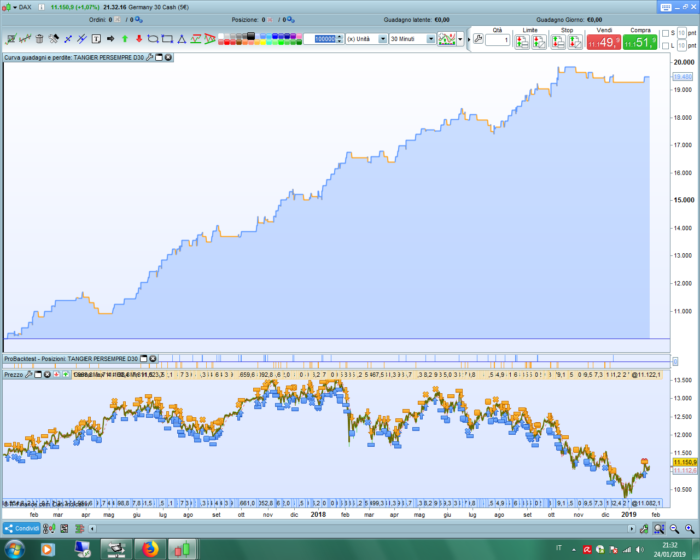

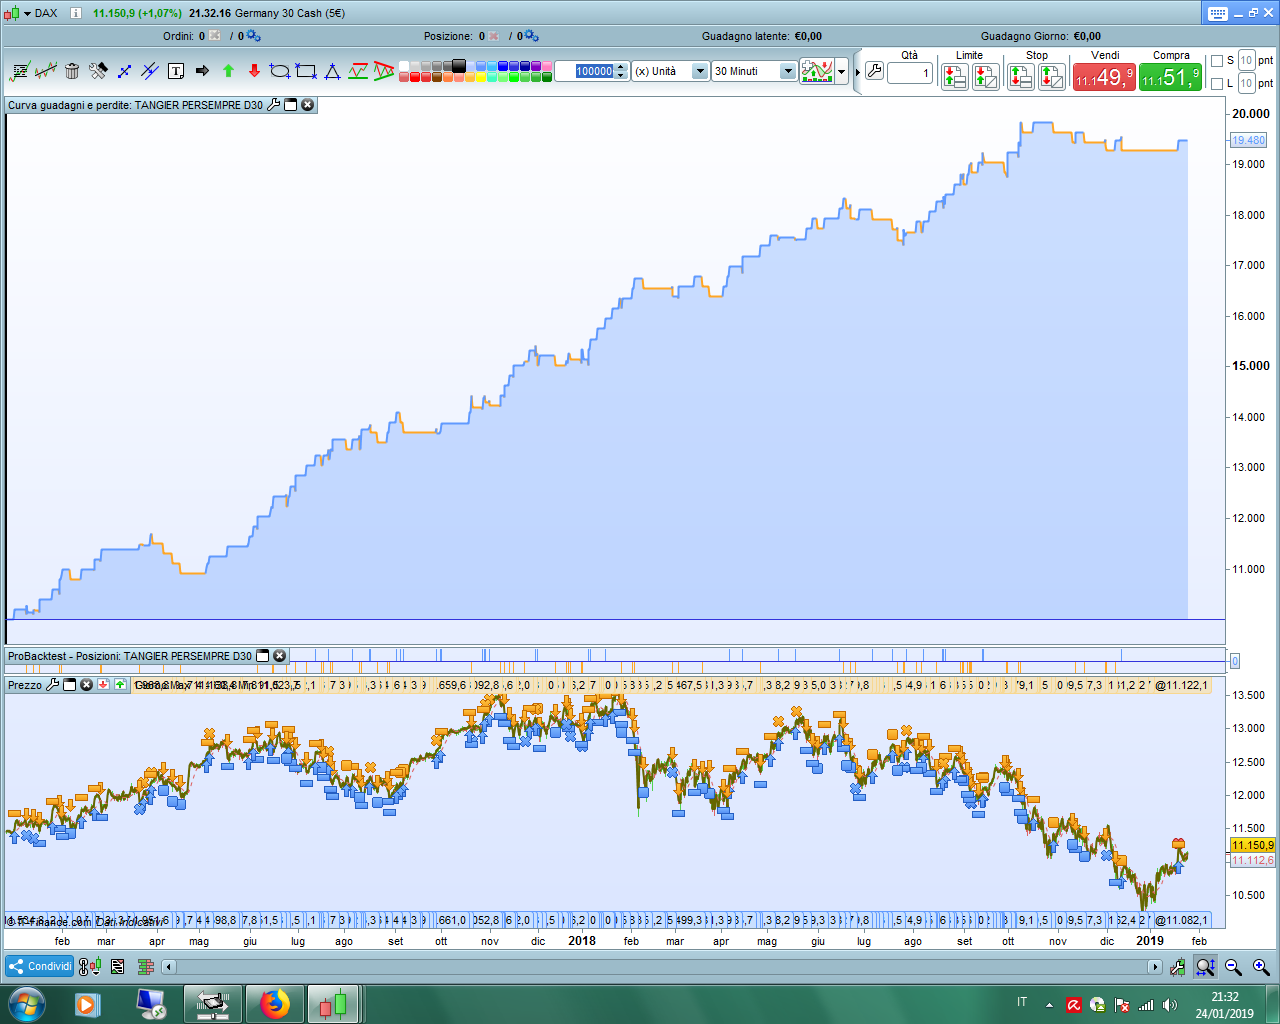


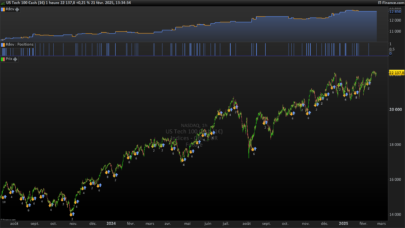


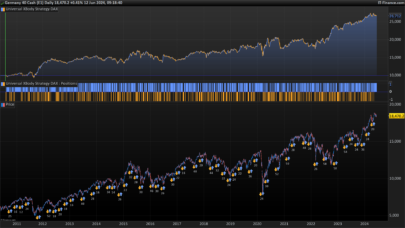


Buon Giorno Discomusic ! Tested with 200k bars tick by tick (16/08/2010->now):
– almost flat from 16/08/2010 till Q2 2015
– capital curve increases since Q2 2015
– win position 50%, profit factor 1,26
– profit = 4719€
– max drawdown 1176€
many thanks!! Interesting… Just a question, please, how is i psssible to obtain the 200k bars for the backtests?
Thanks, have a nice day,
To get 200k bars you must have either a premium or a sponsored CFD account : https://trading.prorealtime.com/it/ig
Hello, Thanks for sharing.
I did a quick test on Wallstreet and it looks pretty good on 1 hour chart. You probably need to raise pips there because there are many 0 bars on closed positions. It seems to be ok even on larger SL and TP levels on wallstreet.
Maybe you should look at more index, to see if there is something there.
Hi! thanks!! Very interesting! I shall make some other test, and then I inform you.
I like to consider us as a team, without secrets or similar… As I guess that ‘together’ we can have more chances.. 🙂
ok, thank you!!!! 🙂
@discomusic have you thought about starting a Thread on the Forum below as this is the norm / good idea so that images can be uploaded and amended code etc? Folks generally put a reference back their original Library post (e.g. this one)
https://www.prorealcode.com/forum/prorealtime-english-forum/proorder-support/
For info … I have just started 3 versions of your excellent strategy on my Demo Forward Test Platform.
Thank You so Much for Sharing
GraHal
Hello, I made some changes attached here
cordially
Hi GraHal! Thanks for the suggestion: I have just created this thread: https://www.prorealcode.com/topic/tangier-germany30-strategy-time-frame-30-minutes/
As PastaPesto remarks, this strategy could work (perhaps better) on other charts. I am doing some test in this direction, with good results..
I shall post here the best of them. Unfortunately I can only load 100k bars backtests.
Let us try to work togheter, to obtain something reliable.
Ciao!
it is really good ?
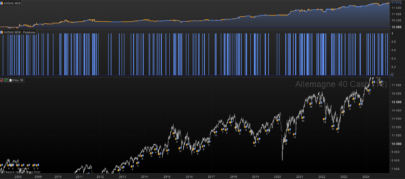
is really good for the cac 40
on 200k test in the red untill 2017 then strong green
Please indicate the trade stat to show ave gain against average lost..
Thanks for sharing the strategy !.
Did you do an Out of Sample run when testing on the 100k bars ? I usually test my strategy with 66% in sample and 34% out of sample (just one, not 5 which is stated by default) on the total run of in this case 100k bars.
I don’t know if anyone is following this thread anymore. Anyway I will post my comment.
After many years I decide to go back to prorealtime and imported this strategy. I am using IG Indexand tried it on Germany30 , 30 mins interval.
My results are totally different from the time period shown (Feb 2018 to Feb 2019). I have 3 trades and a total loss of 130.
What am I doing wrong ? Import of the strategy, same market, same timeframe. Is it IG Index ?
hey i have optimized this code …if anyone whant look it worck on germany 1euro not 5euro that it was …. and only 1 contract
i make 2 versiono first is normal take profit but is very linear profit and second a simply trail stop make more profit.
Hey, i just noticed you optimized this strategy. Could i see your new version, please?
sorry i add my code but it not enter why i dont know
this is code simply stop , and you can see another version for stop
/ Codice principale : TANGIER _ ger30 30min ok
//————————————————————————-
// Definizione dei parametri del codice
DEFPARAM CumulateOrders = False // Posizioni cumulate disattivate
DEFPARAM FLATBEFORE = 090000
DEFPARAM FLATafter = 175500
indicator1 = RSI[25](close)
c1 = (indicator1 CROSSES OVER 50)
c8=close>average[15]
c65=Momentum[12]>momentum[13][1]
c66=momentum[14][1]>momentum[12][2]
IF c8 and c1 and c65 and c66 THEN
BUY 1 CONTRACT AT MARKET
ENDIF
indicator2 = RSI[15](close)
c2 = (indicator2 CROSSES UNDER 60)
c13= average[17]<average[16][1]
IF c2 or c13 THEN
SELL AT MARKET
ENDIF
indicator3 = RSI[22](close)
c3 = (indicator3 CROSSES UNDER 32)
c34=close<average[20]
c65=Momentum[12]<momentum[12][1]
c66=momentum[14][1]average[22][1]
IF c5 or c13 THEN
EXITSHORT AT MARKET
ENDIF
SET STOP pLOSS 40
//tsl = round(440/10000*close)
SET TARGET pPROFIT 40//tsl