Good Day Everyone
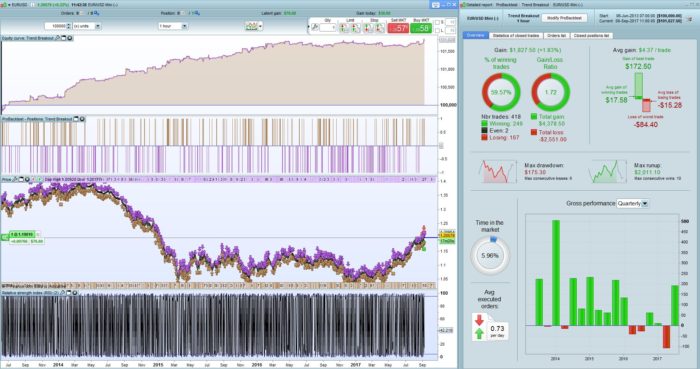
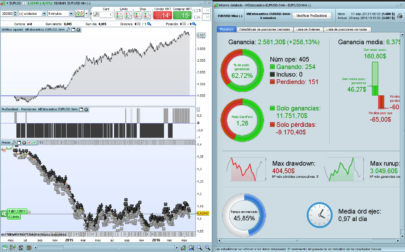
This is probably the craziest strategy I have ever written. It is based on diagonal trend line breakouts. The trend lines are calculated from the extreme of the highest/lowest pivot to the extreme of the next highest/lowest point in the trend. The calculation uses the Tan trigonometry function to calculate the size of the angle between the pivot extreme and the close of the last bar. Violation of the trend line triggers a new stop order and trend direction.
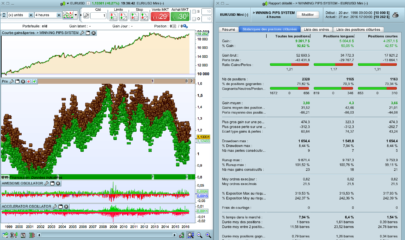
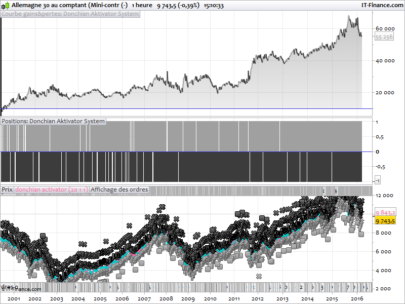
Below the code as adapted for the EUR/USD Mini on the 1Hr timeframe:
|
1 2 3 4 5 6 7 8 9 10 11 12 13 14 15 16 17 18 19 20 21 22 23 24 25 26 27 28 29 30 31 32 33 34 35 36 37 38 39 40 41 42 43 44 45 46 47 48 49 50 51 52 53 54 55 56 57 58 59 60 61 62 63 64 65 66 67 68 69 70 71 72 73 74 75 76 77 78 79 80 81 82 83 84 85 86 87 88 89 90 91 92 93 94 95 96 97 98 99 100 101 102 103 104 105 106 107 108 109 110 111 112 113 114 115 116 117 118 119 120 121 122 123 124 125 126 127 128 129 130 131 132 133 134 135 136 137 138 139 140 141 142 143 144 145 146 147 148 149 150 151 152 153 154 155 156 157 158 159 160 161 162 163 |
//Stategy: Trend Breakout //Author: Juan Jacobs //Market: Neutral //Timezone: UTC +2 //Timeframe: 1Hr but not 'completely' timeframe dependant Defparam cumulateorders = False If hour < 9 or hour > 22 then //outside market hours possize = 0 If longonmarket Then sell at market Bear = 0 Bull = 0 ElsIf shortonmarket Then exitshort at market Bear = 0 Bull = 0 EndIf Else possize = 1 //position contract size EndIf //Calculate Fractal once FracH = 0 //initialize fractal count once FracL = 0 //initialize fractal count For i = 0 to 4 Do If high[2] > high[i] Then //look for high fractal with 2 lower highs on either side FracH = FracH + 1 EndIf If low[2] < low[i] Then //look for low fractal with 2 higher lows on either side FracL = FracL + 1 EndIf Next If FracH = 4 Then //High Fractal Identified If Bear = 0 and Bull = 0 Then Bear = 1 //Initialize first trend direction EndIf FractalH = high[2] //High Fractal Price Level FractalP = barindex - 2 //High Fractal Bar Position EndIf If FracL = 4 Then //Low Fractal Identified If Bear = 0 and Bull = 0 Then Bull = 1 //Initialize first trend direction EndIf FractalL = low[2] //Low Fractal Price Level FractalP = barindex - 2 //Low Fractal Bar Position EndIf FracH = 0 //reset fractal count FracL = 0 //reset fractal count //Calculate trendline using widest angle from extreme of last fractal to curent extreme (Trigonometry Function) If Bear = 1 Then //Down trend Height = FractalH - high //Calcululate height between high fractal and high of current bar HeightB = FractalH - close //Calcululate height between high fractal and close of current bar (used to determine trend violation) ElsIf Bull = 1 Then //Up trend Height = Low - FractalL //Calcululate height between low fractal and low of current bar HeightB = close - FractalL //Calcululate height between high fractal and close of current bar (used to determine trend violation) EndIf If barindex - 2 = FractalP Then //Initialize angle using high of last bar of fractal set MaxAngle = Tan(2/Height) //Initial value of the angle between the fractal and the last high EndIf once Trendbreak = 0 If barindex - 2 > FractalP Then //If current bar greater than end of fractal set: If Bear = 1 Then //For Down Trend If (Tan((barindex-FractalP)/Height) > MaxAngle) and (((close < open) or (close < close[1]))) Then MaxAngle = Tan((barindex-FractalP)/Height) //calculate new max trend if down trend rules are valid Trendbreak = 0 //No Trend Violation Present EndIf If Trendbreak = 0 and (Tan((barindex-FractalP)/HeightB) > MaxAngle) and close > open Then TrendBreak = 1 //Trend violation potentially present, wait for confirmation on close of next bar ElsIf Trendbreak = 1 and (Tan(((barindex-1)-FractalP)/HeightB) > MaxAngle) and close > close[1] Then Trendbreak = 2 //Trend violation confirmed, there was a close outside the trend line (close angle > trend) EndIf ElsIf Bull = 1 Then //For Up Trend If (Tan((barindex-FractalP)/Height) > MaxAngle) and (((close > open) or (close > close[1]))) Then MaxAngle = Tan((barindex-FractalP)/Height) //calculate new max trend if up trend rules are valid Trendbreak = 0 //No Trend Violation Present EndIf If Trendbreak = 0 and (Tan((barindex-FractalP)/HeightB) > MaxAngle) and close < open Then TrendBreak = 1 //Trend violation potentially present, wait for confirmation on close of next bar ElsIf Trendbreak = 1 and (Tan(((barindex-1)-FractalP)/HeightB) > MaxAngle) and close < close[1] Then Trendbreak = 2 //Trend violation confirmed, there was a close outside the trend line (close angle < trend) EndIf EndIf EndIf If Trendbreak = 2 Then //Trend violation is confirmed: If Bear = 1 Then //Down Trend Present (but now broken): BreakoutL = Highest[2](high) //Determine Highest point of violation (including last candle before violation) Buy possize contract at BreakoutL + (AverageTrueRange[7](close)*0.3) stop //Enter into long position at specified price level //N.B. We need to ensure the current position is obviously closed? ElsIf Bull = 1 Then //Up Trend Present (but now broken): BreakoutL = Lowest[2](low) //Determine Lowest point of violation (including last candle before violation) Sellshort possize contract at BreakoutL - (AverageTrueRange[7](close)*0.3) stop //Enter into short position at specified price level //N.B. We need to ensure the current position is obviously closed? EndIf If Bear = 1 and longonmarket Then //If position is opened counter last trend, reset variables Trendbreak = 0 Bear = 0 Bull = 1 ElsIf Bull = 1 and shortonmarket Then //If position is opened counter last trend, reset variables Trendbreak = 0 Bear = 1 Bull = 0 EndIf EndIf //Trade Management (Note that Trend Direction need to be reset with exits's) Deviations = 1.618 periods = 34 PRICE = LOG(customclose) alpha = 2/(PERIODS+1) if barindex < PERIODS then EWMA = AVERAGE[3](PRICE) else EWMA = alpha * PRICE + (1-alpha)*EWMA endif error = PRICE - EWMA dev = SQUARE(error) if barindex < PERIODS+1 then var = dev else var = alpha * dev + (1-alpha) * var endif ESD = SQRT(var) BollU = EXP(EWMA + (DEVIATIONS*ESD)) BollL = EXP(EWMA - (DEVIATIONS*ESD)) RS2 = ROUND(RSI[2](close)) PSH = Highest[100](high)[1] PSL = Lowest[100](low)[1] If longonmarket and ((close[1] > BollU and close < BollU) or (high[1] > BollU and high < BollU) or (close > PSH or close < PSL)) Then LE = 1 ElsIf shortonmarket and ((close[1] < BollL and close > BollL) or (low[1] < BollL and low > BollL) or (close < PSL or close > PSH)) Then SE = 1 EndIf If longonmarket and LE = 1 and RS2 >= 85 and close < BollU Then Sell at market Bear = 0 Bull = 0 ElsIf shortonmarket and SE = 1 and RS2 <= 15 and close > BollL Then Exitshort at market Bear = 0 Bull = 0 EndIf |
Share this
No information on this site is investment advice or a solicitation to buy or sell any financial instrument. Past performance is not indicative of future results. Trading may expose you to risk of loss greater than your deposits and is only suitable for experienced investors who have sufficient financial means to bear such risk.
ProRealTime ITF files and other attachments :
Find other exclusive trading pro-tools on ![]()
PRC is also on YouTube, subscribe to our channel for exclusive content and tutorials


very interesting idea! thanks
would you mind to specify what are the optimized parameters? many thanks
Optimize parameters:
1. Outside market hours (line 9)
2. Highest Point of Violation look back period (line 98 and 102)
3. ATR period and multiplication factor (line 99 and 103)
4. Bollinger Standard Deviation (line 120)
5. Bollinger Period (line 125)
Thank you!
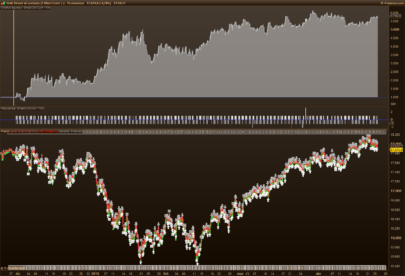
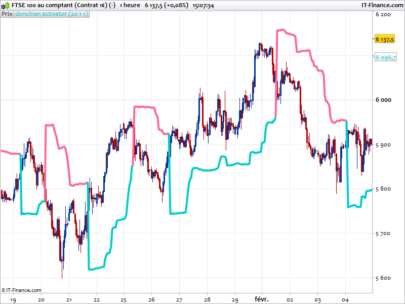
@Nicolas @Wing @Francesco78 I am thinking of ways to make the strategy more robust but will require visual cue’s to assist me in analyzing the strategy. Can one of you possibly assist me in graphing the lines? I will require each revision of the trend line (i.e. every time the trend line is updated it needs to be graphed). This will help me better determine when is the best time to update the trend line and/or when it can be considered violated. Thanx
Should be better with an indicator. As long as we can determined at least 2 coordinates for each line.
The last fractal will be coordinate 1 and the high/low of the candle that generates an angle greater than the previous angle will be coordinate 2
And the point of violation is the close of the candle that violates the line by generating an angle greater than the current angle and closes opposite the active trend
For the latest version of the strategy or to follow updates and developments see the thread here:
https://www.prorealcode.com/topic/calculating-diagonal-trend-lines-using-fractals-and-trigonometry/
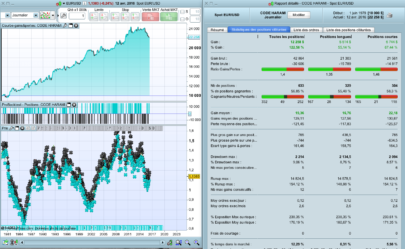
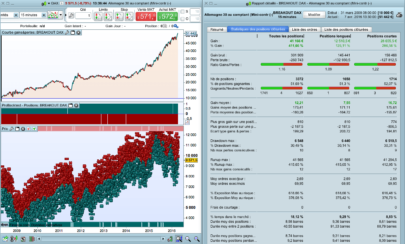
i backtested it with 10K units of EURUSD 1 hour i get an equity curve that is going one way down. What gives? Did I do anything wrong? Or issit just that this algo is ‘outdated’ and no longer fit current set of time series (ie over optimized and not robust)?