







USDJPY trading strategy - 1minTF - SAR and EMA
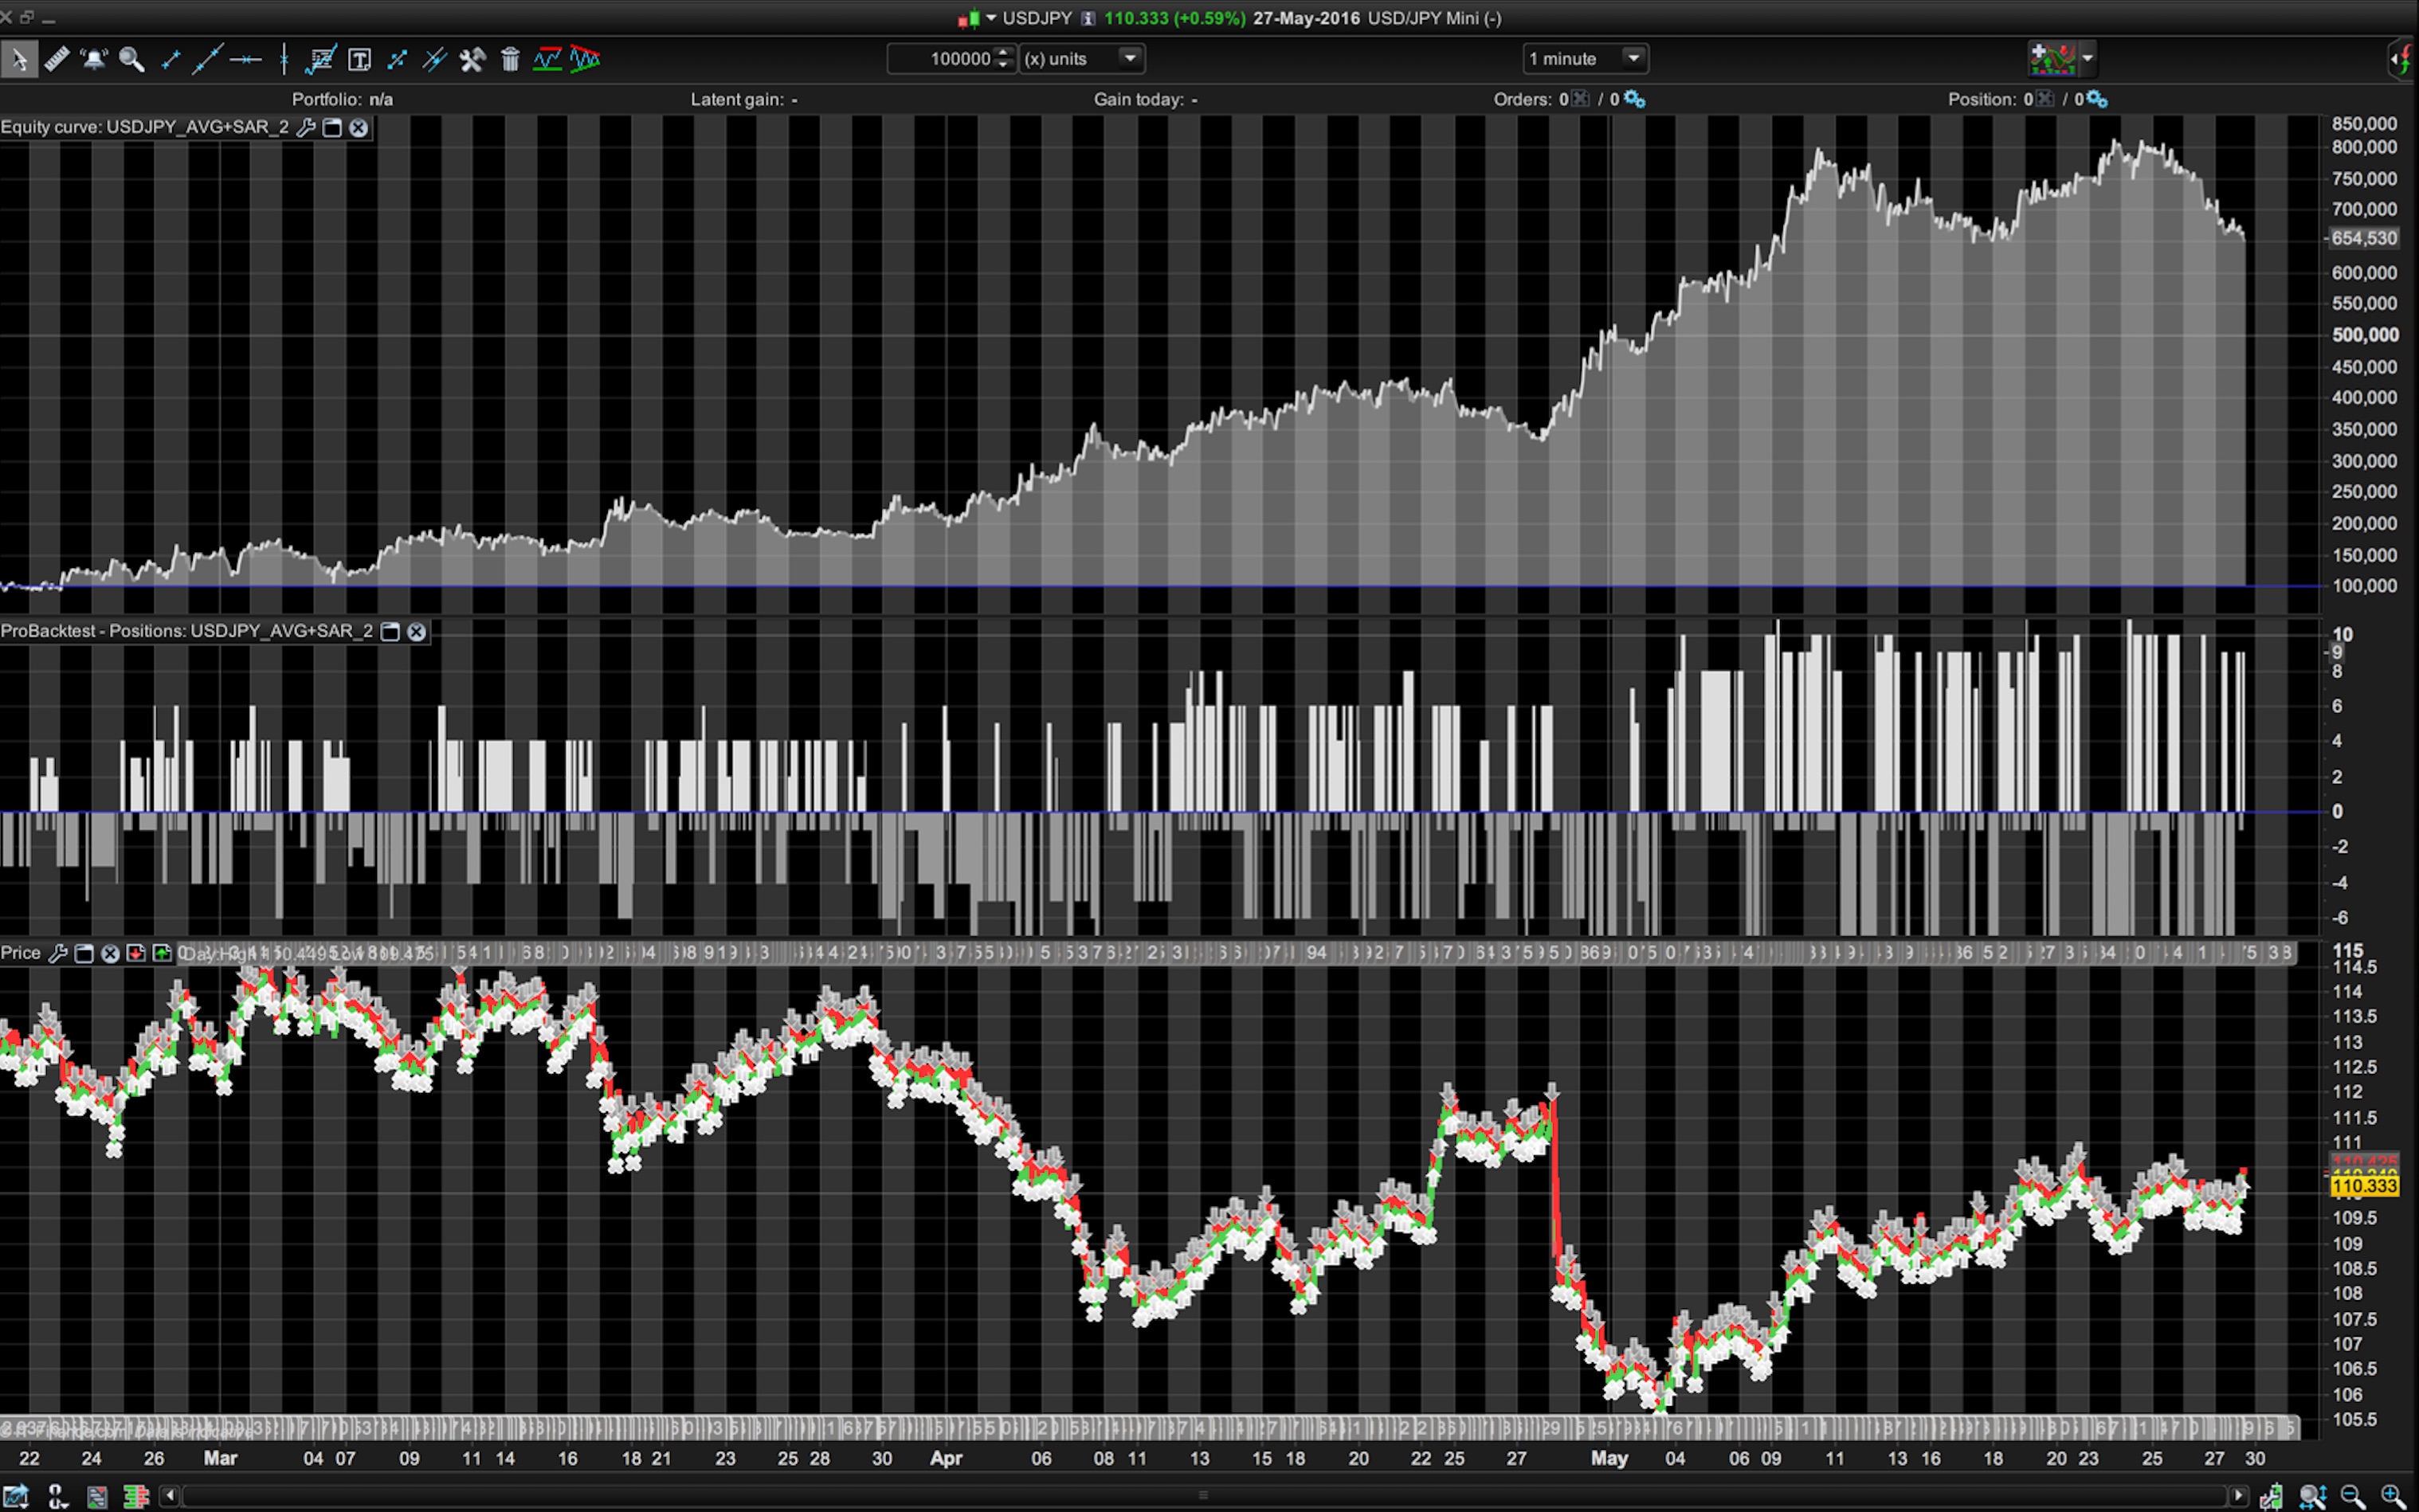
Hi everyone,
Wanted to share my simple Automated strategy for USD/JPY mini using a 1minute timeframe, with SAR and EMA indicators.
Code also includes money management to adjust for position sizes – adjust this for your liking etc.
Any thoughts or suggestion is welcome! Enjoy..
DEFPARAM CumulateOrders = false
//INDICATORS//
mm3= exponentialaverage[200*3]
mm2= exponentialaverage[200*1.5]
mm1= exponentialaverage[200*1]
PARABOLIC = SAR[0.001,0.001,0.2]
C1 = PARABOLIC>HIGH //RED SAR = SHORT
C2 = PARABOLIC<LOW //GREEN SAR = LONG
Spread = 1.1
//

//MONEY MGT//
Equity = (Strategyprofit+20000)
Risk = round(Equity/100000)
Losses = positionperf(1)<0 and positionperf(2)<0 and positionperf(3)<0
streak = positionperf(1)>0 and positionperf(2)>0 and positionperf(3)>0
if losses then
 n = max(abs(round(max(3+risk-2,risk-2))),2)
elsif not losses then
 n = max(abs(round(max(3+risk,risk))),2)
endif
if streak then
 n = max(abs(round(max(5+risk,risk))),2)
endif
//

T1 = (barindex-tradeindex>=3)
T2 = (barindex-tradeindex>=3)

//ENTER LONG//
if (mm1>mm2 and mm2>mm3) and c2 AND T1 then
 buy n contract at breakeven+spread*pipsize limit
 breakeven = parabolic
  if T2 and longonmarket then
   sellshort at breakeven+spread*pipsize stop
  endif
endif

//ENTER SHORT//
if (mm1<mm2 and mm2<mm3) and c1 and T1 then
 sellshort n contract at breakeven-spread*pipsize limit
 breakeven = parabolic
  if T2 and shortonmarket then
   exitshort at breakeven-spread*pipsize stop
  endif
endif

Comments
You must be logged in to post a comment.


Hi Pascal
There's lots not clear to me! :)
Are you referring to C1 = PARABOLIC>HIGH //RED SAR = SHORT? If Yes, then attached shows the condition of the SAR break ... the red dots crossing over the High. Does that help at all?
Mmm just remembered, the website doesnt allow pics to be attached to Comments in the Library. Here's a link and a a few words that may help
The indicator is below prices when prices are rising and above prices when prices are falling.
http://stockcharts.com/school/doku.php?id=chart_school:technical_indicators:parabolic_sar
GraHal

Sorry i have an error on downloading the graph PRT ...
I tested this strategy: something is not clear ! why does it open short position to the break of the bearish SAR ? (See for example attached graph which shows a losing trade.)
The reversal of trend is precisely at the break of the SAR, so why not buy instead of selling ?
I like this Strategy very much, but the snippet below (starting at Line 34 in the full Code) leaves me thinking it needs improving? Anybody else think the same please?
The weird thing is it works as below, but I cant help thinking that more conditions / trading rationale behind the exit would give more profit? I have tried more conditions in the Strategy but results in less profit :(
Hoping this will get the full Strategy 'back on the radar' and discussed further by members?
if T2 and longonmarket then
   sellshort at breakeven+spread*pipsize stop
  endif
endif
Thank You
GraHal

If you have an EA with 600 period, why you leave 200 DEFPARAM preloadbars? I think this must be set to 600 at least? is it right?

Hi Grizzly and very nice code. It seems like the BREXIT shout down the Equity curve when backtesting, how did it perform Live?
Cheers Kasper

Hi Dymjohn
In the absence of a better explanation ... when optimising parameters you could use - for example - X (in place of 200) from 5 to 100 in increments of 5 and thus complete one optimisation run, resulting in max profit at X = 50 and EAs would then end up as ...
mm3 = EA[50*3] = EA[150]
mm2 = EA[50*1.5] = EA[75]
mm1 = EA[50*1]= EA[50]
Hope above makes sense??
Cheers
GraHal


Hey grizzly and thank you for your code. I especially like the exit via SAR instead of hard stops! I have the IG version of PRT with only 100000 bars. So if I backtest the code today i can only backtest it to 30/03-16. It would be nice if someone with the real PRT could test the new code that fredd81 summit in the thread and post a picture of the result here :)
Take care.

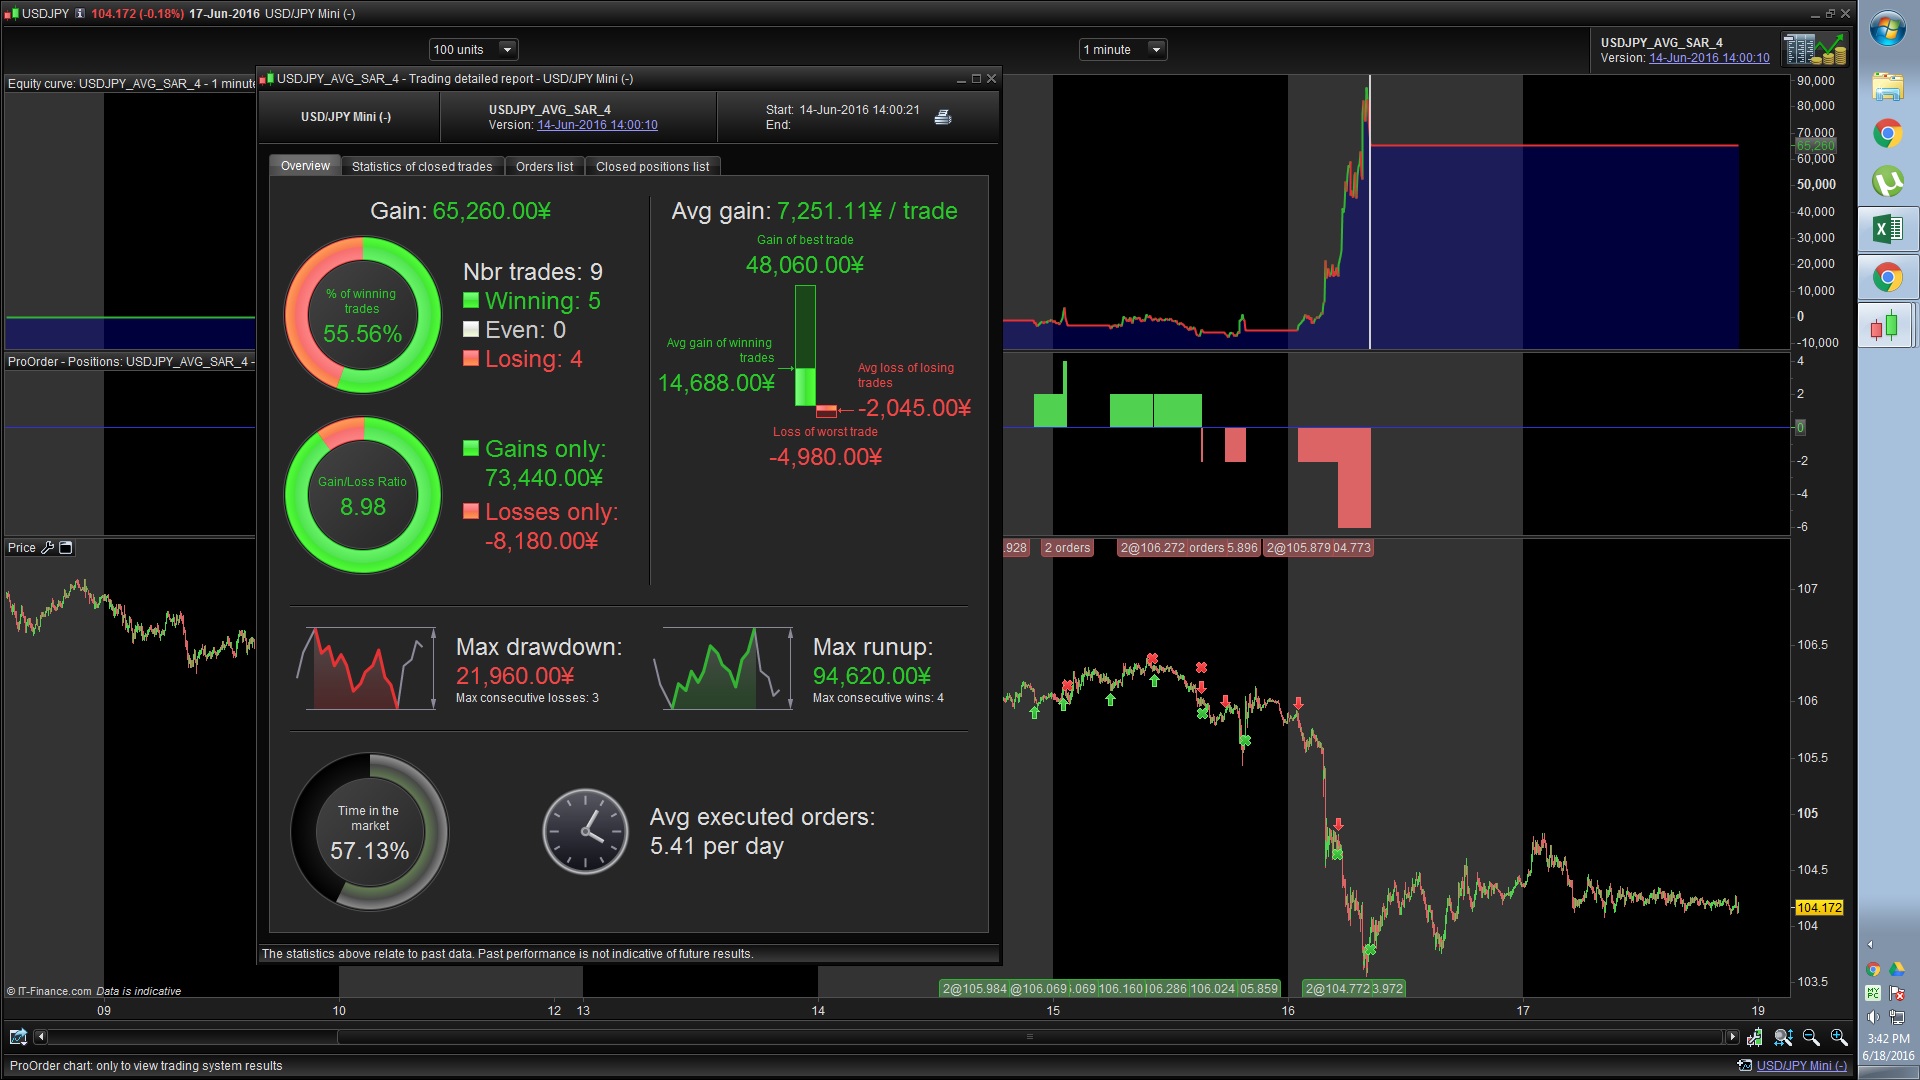
Guys, my results posted above will be slightly different as I have been running a modified version. It's largely the same code but with my own Risk parameters which will vary according your account size etc.
Week 4 was ~15k Yen gain. Short week as I stopped the system on Thursday (! day before Brexit vote)
Week 5 - currently a ~40k Yen loss.

Hi grizzly
I have all currencies UTC+1
After today im in profit but thats after 3 small wins and one bigger. i saw you hade lower worst trade and better best trade and more win/ loss ratio on you new screenshot, what have you improved ? my code is as follow
Havent changed anything and added NFP code at the bottom
Thx
//-------------------------------------------------------------------------
// Main code : USDJPY_AVG+SAR_2
//-------------------------------------------------------------------------
DEFPARAM CumulateOrders = false
//INDICATORS//
mm3= exponentialaverage[200*3]
mm2= exponentialaverage[200*1.5]
mm1= exponentialaverage[200*1]
PARABOLIC = SAR[0.001,0.001,0.2]
C1 = PARABOLIC>HIGH //RED SAR = SHORT
C2 = PARABOLIC<LOW //GREEN SAR = LONG
Spread = 1.1
//
//MONEY MGT//
Equity = (Strategyprofit+20000)
Risk = round(Equity/100000)
Losses = positionperf(1)<0 and positionperf(2)<0 and positionperf(3)<0
streak = positionperf(1)>0 and positionperf(2)>0 and positionperf(3)>0
if losses then
n = max(abs(round(max(3+risk-2,risk-2))),2)
elsif not losses then
n = max(abs(round(max(3+risk,risk))),2)
endif
if streak then
n = max(abs(round(max(5+risk,risk))),2)
endif
//
T1 = (barindex-tradeindex>=3)
T2 = (barindex-tradeindex>=3)
//ENTER LONG//
if (mm1>mm2 and mm2>mm3) and c2 AND T1 then
buy n contract at breakeven+spread*pipsize limit
breakeven = parabolic
if T2 and longonmarket then
sell at breakeven+spread*pipsize stop
endif
endif
//ENTER SHORT//
if (mm1<mm2 and mm2<mm3) and c1 and T1 then
sellshort n contract at breakeven-spread*pipsize limit
breakeven = parabolic
if T2 and shortonmarket then
exitshort at breakeven-spread*pipsize stop
endif
endif
//PROTECTION - Volatility spikes e.g. NFP or BoJ days//
GappingLoss = abs(parabolic-close)>(70*pipsize) //~70pip from SAR loss
GappingProfit = abs(parabolic-close)>(50*pipsize) //~50pip from SAR gain
if T1 and longonmarket and positionperf<0 and gappingLoss then
sellshort round(n*1.5) contract at market
//exitshort at parabolic stop - not included
elsif T1 and shortonmarket and positionperf<0 and gappingLoss and c2 then
buy round(n*1.5) contract at market
//sell at parabolic stop - not included
endif
if T1 and longonmarket and positionperf>0 and gappingProfit then
sellshort round(n*1.5) contract at market
//exitshort at parabolic stop - not included
elsif T1 and shortonmarket and positionperf>0 and gappingProfit and c2 then
buy round(n*1.5) contract at market
//sell at parabolic stop - not included
endif
Hey Grizzly, I know this probably doesn't belong to this post, however, don't know how else to get in touch with you.
Assuming you have an IG linked PRT account, have you managed to get PRT Premium linked to an IG account? I am finding this may not be possible for Australians.
Cheers
Steve