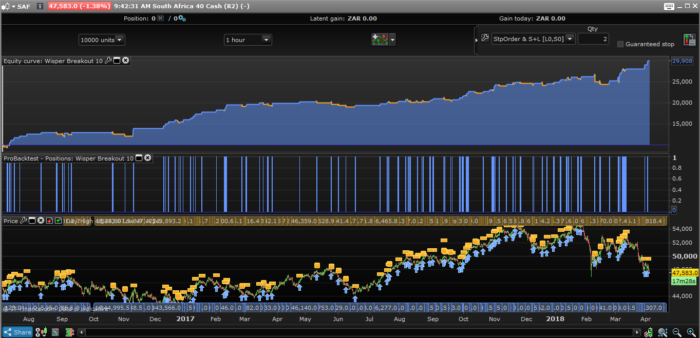
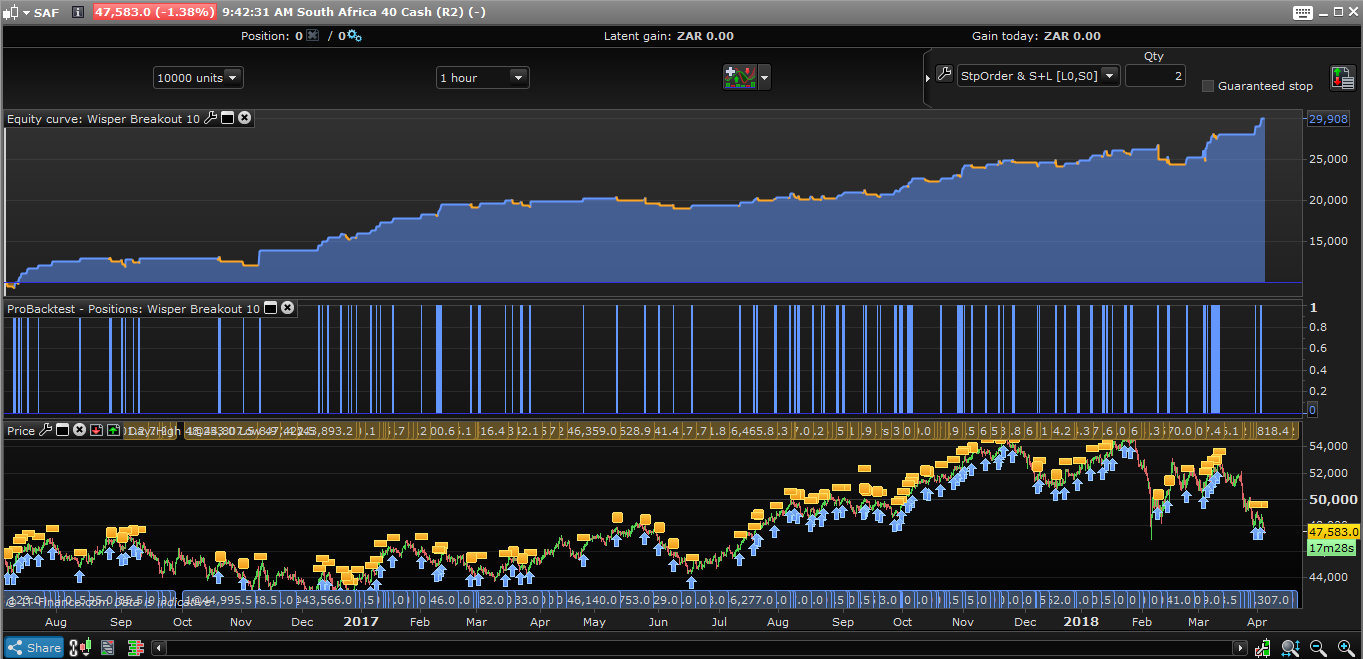
This strategy is one which takes advantage of only long opportunities in the SA Top 40 (SAF40) Index also known as the ALSI.
The code is testing if price is making new highs and lows before setting a new long order at market.
Target and loss levels are based upon the size of a factorized ATR 14 periods. Take profit size is larger than the stop loss one.
|
1 2 3 4 5 6 7 8 9 10 11 12 13 14 15 16 17 18 19 20 21 22 23 24 25 26 27 28 29 30 31 32 33 34 35 36 37 38 39 40 41 |
//------------------------------------------------------------------------- // Main code : Wisper Breakout //------------------------------------------------------------------------- // Definition of code parameters DEFPARAM CumulateOrders = false // Cumulating positions deactivated daysForbiddenEntry = OpenDayOfWeek = 1 OR OpenDayOfWeek = 0 // Conditions to enter long positions c1 = (close[3] <= high[4]) c2 = (close[3] >= low[4]) c3 = (close[2] <= high[3]) c4 = (close[2] >= low[3]) c5 = (close[1] <= high[2]) c6 = (close[1] >= low[2]) if high[4] > high[3] then ath = high[4] else ath = high[3] endif if high[2] > ath then ath = high[2] else ath = ath endif if high[1] > ath then ath = high[1] else ath = ath endif c7 = (close > ath) IF c1 AND c2 AND c3 AND c4 AND c5 AND c6 AND c7 AND not daysForbiddenEntry THEN BUY 1 CONTRACT AT MARKET ENDIF // Stops and targets atr = AverageTrueRange[14](close) SET STOP pLOSS atr * 2 SET TARGET pPROFIT atr * 2.5 |
Share this
No information on this site is investment advice or a solicitation to buy or sell any financial instrument. Past performance is not indicative of future results. Trading may expose you to risk of loss greater than your deposits and is only suitable for experienced investors who have sufficient financial means to bear such risk.
ProRealTime ITF files and other attachments :
Find other exclusive trading pro-tools on ![]()
PRC is also on YouTube, subscribe to our channel for exclusive content and tutorials


I take it you did not consider that the spread could be anything from 30 to 50 pts. Especially outside market hours.
I have been trading this system for 4 months uninterrupted. I can assure you that I considered the spread. The Stops and Targets is wide enough, don’t let last nights trade upset you.
If I run the backtest with a zero spread the backtested result look similar to your screenshot. If however, I include a realistic spread of 40 the backtest only show the strategy to be profitable after November 2016. The strategy opens trades both in and out of market hours, meaning it would make sense to include an average spread between the usual 30 (in market hours) and 50 (outside market hours).
If you have a high percentage winners and the trades are closed with take profit the spread doesent matter that much as long price exceed the TP by half the spread
I Agree with you JaunJ, and Yes Eric, what you say makes sense too. Optimizing the Stop Loss and Profit Target to 3.9 and 3.5 X ATR respectively back-tested in favour of the system at a spread of 30. I guess we can play around with the numbers but ultimately I feel that the logic of the system still holds true.
Thanks for the system Casenova. In determining the high of the past 4 bars, is there a reason you didn’t use the “highest” command? I’m getting to grips with the code and was curious.