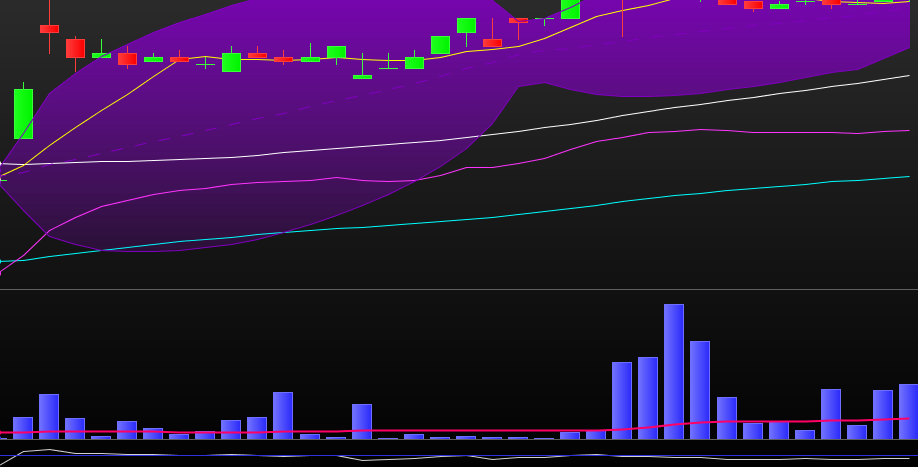
hi all , just learning coding so im starting simple , if someone could help please , im after the code in the title of the code script not title of thread , volume 50% above average volume
i know the below is not right but i think it is close , i ammended it from one of my previous requests , not sure how to add the sma 7 above sma 50 but only by no more than 5 bars
thank you very much to anyone that helps
//7 day sma trending up but above 50 day sma by less than 5 bars
//with volume 50% higher than the 200 day average

ma7=average[7](close)
ma50=average[50](close)

test = ma7>ma7[2] and ma7>ma50 and volume>average[200](volume)*1.5

screener[test]
the 7 day sma below the 50 day sma trending up with 1.5 times average volume has worked for me my last two trades taking 50% profit for the week got to love that , i do look at other fa things like money in bank to reduce cr risk , i also look at the management and what they have done in past , might be luck but im looking to also check the stocks that have just crossed over the 50 day sma , good luck all with your trading and again thanks for any help
ill try this without any help hopefully im right lol
//7 day sma trending up but above 50 day sma by less than 5 bars
//with volume 50% higher than the 200 day average

ma7=average[7](close)
ma50=average[50](close)

test = ma7>ma7[2] and ma7>ma50 [<5] and volume>average[200](volume)*1.5

screener[test]
Please don’t post code with line numbers. It may happen that Copy & Paste adds line numbers, but you can easily remove them.
Thank you.
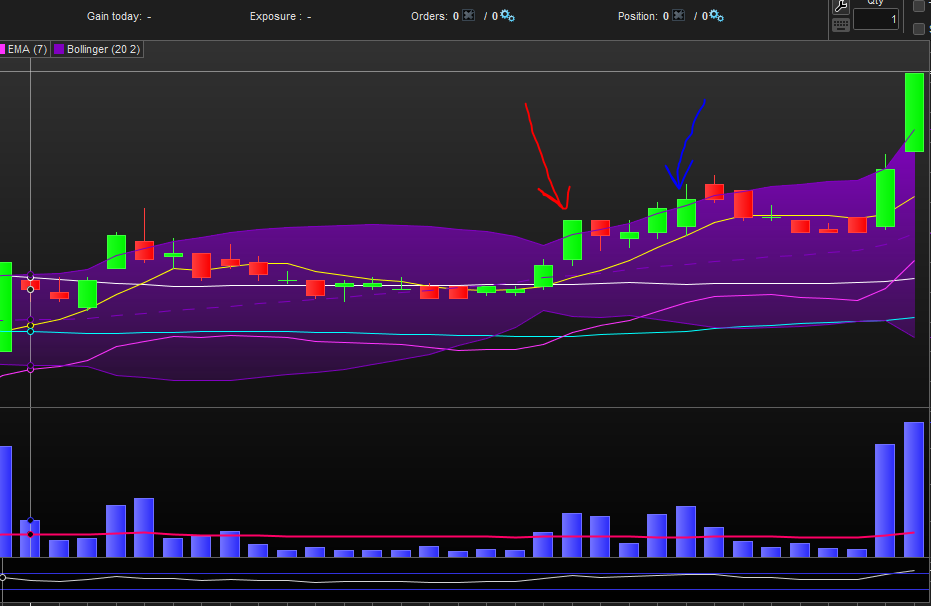
mmm nope didnt work , im wanting the stocks to screen where the from the red arrow to the blue above the 50 day sma , so the blue arrow should be the current date at the most and the cross over 5 days before
sorry both pictures are the same i cant delete one or at least i dont know how to
There you go (not tested):
ma7  = average[7](close)
ma50 = average[50](close)
test = summation[6](ma7>ma7[2] and ma7>ma50) < 6 and volume>average[200](volume)*1.5
screener[test]
You are comparing current MA7 agains the 2nd previous MA7, ok? (the previous one is MA7[1])
Actually this is correct, since the most recent bar mast have a valid condition:
ma7  = average[7](close)
ma50 = average[50](close)
Cond = ma7>ma7[2] and ma7>ma50
test = Cond AND summation[6](Cond) < 6 AND volume>average[200](volume)*1.5
screener[test]
There you go (not tested):
ma7 = average[7](close)
ma50 = average[50](close)
test = summation[6](ma7>ma7[2] and ma7>ma50) < 6 and volume>average[200](volume)*1.5
screener[test]
ma7 = average[7](close)
ma50 = average[50](close)
test = summation[6](ma7>ma7[2] and ma7>ma50) < 6 and volume>average[200](volume)*1.5
screener[test]
You are comparing current MA7 agains the 2nd previous MA7, ok? (the previous one is MA7[1])
thank you Robert , i was close , im thinking the ma7 is uptrend two bars ?
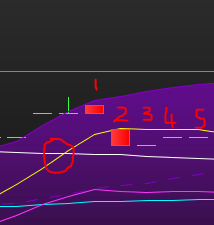
Hi Robert i tested and thank you but it isnt doing what im after , ive attached a picture ,ive circled the yellow 7 sma cross the 50 sma or should that be touch? , and at most 5 days above the 50 day sma white , so what i mean is the current day could be any one of of the 5 bars after touching
i hope you understand what i mean and again thank you kindly for taking the time to help
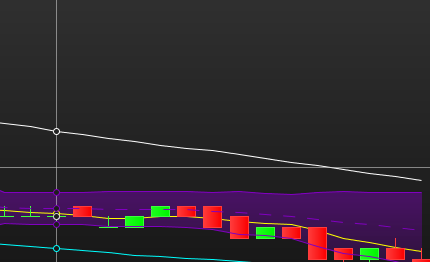
here is a graph of the code you helped with , you can see the yellow sma7 is well below the sma 50 white?
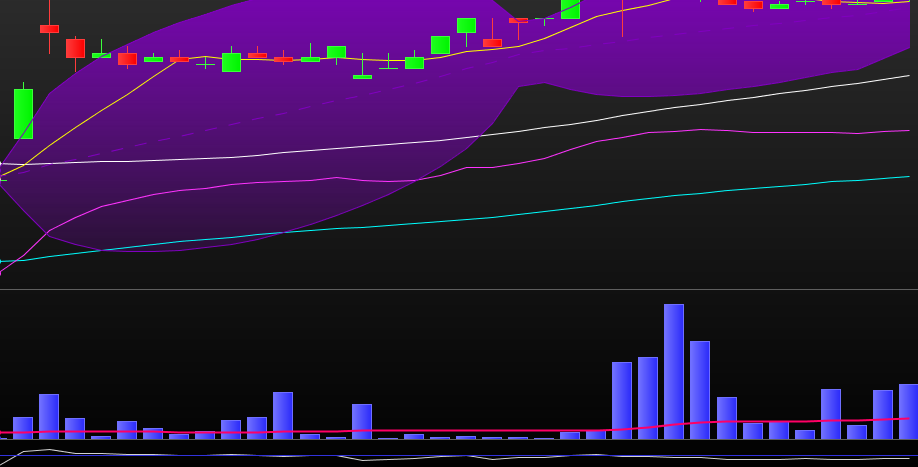
and image two shows the yellow sma 7 crosses white sma 50 and there are 40 odd bars after the crossing?
i guess what im saying is i want to see stocks that the 7 day sma has touched or gone above the 50 day sma less than 5 days from current close date
so i would see stocks that have touched on the current day
i would see stocks that are over on the next day trending up
i would see stocks that are over on day two after crossing and up to day 5 after crossing but must be trending up,
i hope im not being confusing , i know what i want just not how to explain it well i dont think
What’s the instrument and TF in your pics?
Did you use my second version?
yes i tried all the codes you put up mate
TF? im assuming you mean technical ? and instrument he software?
if so
the software is pro realtime
yellow line 7 day sma white 50 day sma , purple 7 day ema blue 50 day ema , ive had good success lately catching the 7 day sma or ema crossing the 50 day on very good volume and then checking the fundamentals
TF = Time Frame
INSTRUMENT = Fx pair, Stock…
I need to replicate your results.
time frame one day is that what you mean?
i dont understand FX pair sorry
stock is the asx australia , the pictures are just examples of one of the stocks your codes gave me