array variables availability in ProRealTime – examples and discussions

Forums ProRealTime English forum ProBuilder support array variables availability in ProRealTime – examples and discussions

Viewing 15 posts - 226 through 240 (of 247 total)
  • #235258

    While I’m here……..

    So I’m just playing around with the free online PRT, daily data only.

    I read somewhere that with realtime data, arrays update not on the close, like a normal variable would, but tick by tick? I understand that price moves tick by tick, it doesn’t just go from open to close… but is there a way of the array updating on close only/only using close data/not being thrown out of whack by unwanted tick data? Is this even a concern if everything calculates at the open? And my array data is only based on high low open close data?

    Silly question, I’m sure, have done a quick bit of reading and couldn’t quite find an answer.

    Again, many thanks,

    Finning

    #235259

    Hi Finning,

    I can’t be sure what you have read, but it could be in the direction of my previous post. It would be opportunistic from my side, though.

    Anyway, for normal operation in Strategy code, the data is always updated at the end of the bar. Also for arrays, when they are filled in there (thus, in Strategy code).
    In other words, once you receive real time data, there won’t be an additional issue for you.

    Something else : real time data is not at the same level as tick data vs second or hour etc. data. Not-real time data is just postponed date (like 15minutes). All what you receive (tick vs bar data etc.) is just the same for real time as for postponed; postponed it only later (hard to trade upon and with AutoTrading it is not even allowed to trade with).

    Regards,
    Peter

    1 user thanked author for this post.
    #235260
    JS

    Sorry (last attempt), arrays don’t update at the end of the bar, even when they’re wrapped in strategy code…

    (Arrays are decorrelated from the barindex)

    #235261

    @PeterST regarding…

    With the danger of missing all the/your points …
    Are you saying that with this you try to achieve the tick values to get known in Strategy code ? Even if you say No, I’d say that you may be on to something in the direction of a solution to that. This would change the subject somewhat 😉 but who cares.

    When I talk of tick’s, I’m referring to the movement shown on the 1 Tick chart which appear to be timestamped at 1 second intervals but several entries can fall under same second. Other times none.

    I was only trying to understand, what was going on with the array, however, the tick scenario did cross my mind, I’ve come across it before in a loop trying to setup a multidimensional array.

    The problem in the loop was , it appeared to fall foul on the number of iterations the loop was making.

    Every time there was a pass in the loop, the value updated, this by the loop speed time rather than linked to the tick movement, I thought.

    In this scenario, it was happening outside a loop, and appeared to be in sequence with the tick movement. Interesting!

    Not explored,  just seemed to be a by product of looking at the affects of the different lines of code in the example.

    If it were useable, there still would be the end of bar hurdle, and if any other tick info were accessible, that would need to be stored in arrays too.

    Going back to example, see image,

    I was trying to understand why, using ‘Once’, appears to define ‘a’ {ex1} and $var[a] {ex2}, or they get defined in ‘Print’ or on ‘Return’ line.

    Then {ex3}, appears to work on the build of the chart, but then skews off appearing to trigger on every tick after build.

    And then {ex4]},    adding ‘a = a + 1’,  turns array into undefined,

    That’s about as far as I got with it, my mind was blown by then.

    Only think I have come up with is, the chart build is retrieving one value per bar, and after, its updated by the ticks. in real time.

    Not got anything on why ‘a=a+1’ undefines the array, since it seems to be defined in the earlier {ex2 and ex3}

    1 user thanked author for this post.
    #235263

    Hi @JS,

    I understand that array’s don’t hold a previous bar value like the general variables.

    But when you say ‘arrays don’t update at the end of a bar’, are you referring it to a general variable,  at the end of a bar which was var[0] and then become var[1].  Or, that the array will just hold its current value at the end of the bar, which is available in the next bar, Or something else.

    I do seem to picture general variables, as arrays, every new bar gets added to the array and when you access it , it’s like  var[n] = var[max-n].


    #235271

    In this scenario, it was happening outside a loop, and appeared to be in sequence with the tick movement. Interesting!

    Doing things in a loop to retrieve ticks (tick values) is not going to work;
    Your program is called once per time unit as defined (1 hour, 1 second etc.) and it is given the fixed state of everything that was in order at the moment your program was called. So no matter how long the loop (make it a billion iterations and it may last a few seconds), the state of all remains the same. No new bar (OHLC) or tick values will emerge during the time your program runs. Side note : what will happen though, is when your program runs 4 seconds while the bar is 1 second (set by you), that things will go bananas, because the PRT server will try to call your program at the end of each second (thus once per second) while it still runs because it takes longer than 1 second. This will create an erroneous situation (don’t ask me what you will notice of it – maybe at the very long term (an hour ? longer ?) some error, because “buffers” will overflow).


    When I talk of tick’s, I’m referring to the movement shown on the 1 Tick chart which appear to be timestamped at 1 second intervals but several entries can fall under same second.

    I am not saying hat you confuse things, but it is easy to be confused when looking at the several “dimensions” which may occur. A few things on this :

    • A 1 tick chart is just that and it exists at the same level as a chart could bear a timeframe of 1 hour or one second or one week etc. etc.
    • A chart based on ticks could also be build from more than one tick (as per your own definition), like 10 ticks or 100 ticks or 11 ticks, etc.
    • The difference between a chart based on ticks and the charts based on time, is that the charts based on ticks do NOT allow strategy code to be called (this is not general law, but counts for ProRealTime). Thus, just NOT – also not per 100 ticks or whatever the set number of ticks is. You thus can also never build tick data from such a chart. Your program just is not called (you can’t even create it – you can try that out). This, versus the timed charts which do allow your strategy code to be called (per time unit as set by you).
    • Now over to the confusing part : The above is about Charts and how Strategy code could be working on/with them. But there is also Signals. Your last post gave examples from signals. Signals are a different beast as these are called per tick so your Signal code is executed per tick. So signals are operating at the tick level all right.
    • As per my explanation above, your Signal program is called each tick. You could plot whatever data you like per tick. You could plot price data per tick. You could add prices and form an average per tick.

    BUT

    • you can not store data per tick.
      All you can do is store data per the timed bar of your chart *if* the chart bears timed bars (if it is a chart based on ticks you can’t do anything at all because, remember, you can’t even have a program which is called).

    The above summarized in one sentence : within Signal code you can plot at the tick level, while variables can only be given (saved) contents per when the timed bar in the calling Strategy code, unwinds.
    Possibly this can be read as : you can set variable a to anything you want per tick the Signal code is called, but you can only really save something in “variable a” when “variable a” occurs in the Return command (and the Return command magically only executes when your timed Strategy code is up to its next bar(-call)).

    And what I was suddenly seeing in my previous post, is that an Array element could persist its given value per tick in the Signal code after all. And what it requires is looping through the array in the calling TIMED Strategy code and add its values in order to prove it.
    If this works it can almost be called a bug, seen from the fact that nothing anticipates it.
    And to keep in mind : it is useless to make a loop in the calling Strategy code and Print or Graph it, because only one command comes through per your called code, which is at most once per 1 second. Thinking further : you could, however print $var[1], $Var[2], $var[3] (up to 10) within the one call. While this would work and you could show to yourself 10 elements of the array per (say) 1 second, you would have a table with 200 last occurred rows and when applied to a more volatile instrument (Nasdaq, EUR/USD), you would see at least a few rows with some different values (each row represent the 10 captured tick’s data).
    In order to let this work for real, there needs to be a base variable that increases with 10 each call, so what you print would look like
    Base = Base + 10
    Print $Var[Base+0]
    Print $Var[Base+1]
    Print $Var[Base+2]
    […]
    Print $Var[Base+9]

    As you noticed, I am from the Delegation Department. 🙂

    1 user thanked author for this post.
    #235272

    I am not sure I have  completely understood what your topic is all about, as I did not read ALL posts.

    I just want to point out that arrays are updated every tick, so you could store any incoming price tick in a huge array. This example shows the array growing live, be it in a Daily, 1-minute or 1-second timeframe:

    if you comment out the islastbarupdate IF…ENDIF block, the count will start from the first preloaded bar.


    2 users thanked author for this post.
    #235273

    Yes Roberto, that was my part of the subject (a bit changed from how it started out a couple of days ago). Thank you for the confirmation.


    you could store any incoming price tick in a huge array.

    What remains is my earlier remark on this : This is hardly usable because of the too many ticks (like 10000 per second at “heavy” volatile times). Thus, the Array can still be 1 million elements only, so what to do with the huge amount of ticks.

    You could make a “rolling” array of max 1 million elements where each call of the timed bar maintains a variable “StartHere”. This starts out at 1 (or 0 if PRT Arrays are 0 based) and may be (automatically) set to 7014 after 1 second and the end of the (1s) timed bar (7014 ticks came in). Thus, StartHere = LastSet($Var). When StartHere is 1 million you reset it to 1 (or 0). You always loop through 1 million elements, assumed you want 1 million elements for history. If that is 50000 then StartHere resets at 50000 to 1 (or 0). Note : you can not shift (First In First Out) the elements because that will take a year to do.
    I hope this is clear ?

    Alternatively, I think that you could also work with e.g. 10-tick “bars”, but I am not sure about this at all. What I mean is :
    Now the Signal bears a timeframe of (e.g.) 10 TICKS, and the signal now (hopefully) updates once per 10 ticks only. Now you have 10 times more space for underlaying ticks, but knowing that each by you registered tick comprises of the average of 10 ticks. I say “average” but it will be a total which you later may divide by 10 (and then you’d have an average). Again, if it works like this – I have the hunch that the Signal code may still be called each tick. But in that case you could store the average of 10 ticks in one Array element.

    What are we going to do with this all ? I don’t know. You still can’t trade on the tick data itself. But you could sort out ultra short trends (like the trend over 10 milliseconds – believe it or not, this is useful). Still, how to apply that will be in a different league because your strategy code will still be called once per 1 second. I can imagine that I could make something of this myself (fired from the Delegation Department) and even share the code (something I have never done so far). Whether this would be useful for any of you out there ? I don’t know. If you (want to) auto trade with 1 second timed bars – and NOT with slower timeframes at the same time, you could be in for a treat; your strategies would be(come) pure technical (no indicators whatsoever), like my own always are. But I don’t see many people doing this currently ?
    Below a very special teaser. And if too many people like this, ProRealTime will be in the market for a couple of additional servers for her customers.

    #235276

    I tested my snippet above also on a 10-tick and 100-tick chart, there’s no change, every single tick the array grows.

    You are right PeterSt, looping through the array once you have reached a previously set limit, restarting from the beginning and overriding old data, is the only way to somewhat get what you need.


    #235284

    Hi @PeterSt,

    I’m not looking at using tick data. Daily at this stage. If the same idea I have works on smaller timeframes, sure, why not, I might give it a go there too. Which has me wondering about this statement you made:

    Side note : what will happen though, is when your program runs 4 seconds while the bar is 1 second (set by you), that things will go bananas, because the PRT server will try to call your program at the end of each second (thus once per second) while it still runs because it takes longer than 1 second. This will create an erroneous situation (don’t ask me what you will notice of it – maybe at the very long term (an hour ? longer ?) some error, because “buffers” will overflow).

    With what I’m testing now, lets say for 10,000 bars, it’s taking, say, 6 seconds to process an indicator, which I will incorporate into my system for use – probably that and something with a couple more layers of complexity. Because of what the indicator is, and how it works, it would need to be pre-loaded with data, and constantly use 10,000 bars of data to get the value I’m looking for (let’s say 10,000 for this conversation), so that processing time for each bar is going to be there. My computer does a lot of whirring when that’s happening, so it sounds like its processing locally, and not remote, as it apparently is when you trade live with PRT.

    So, does this mean that:

    A – I shouldn’t be looking at 5 second bars if it’s taking 6 seconds to process? Ok, I am taking things quite literally with this, but if I’m looking at ever more complex calculations that are going to take longer to compute, what is the “science” of how long something takes to compute, and the minimum timeframe length that you would expect it to work on without fault.

    B – Will my trade price then be a lot further away from the open then in terms of time executed from open time, because of how long it’s taking to get to an answer, before it decides to buy?

    C – Could you put in useless “junk code” to process, to push your trade time out from the open of the bar, if that’s what you wanted to do? Not that I ever would, but it was just a spinoff on the points above.

    Thanks all, and even I don’t use ticks, am finding some of the ideas in this thread very interesting.

    Cheers,

    Finning

    #235289

    Hi again @Finning,

    With what I’m testing now, lets say for 10,000 bars, it’s taking, say, 6 seconds to process an indicator

    First off, in this thread I have been calling Indicators “Signals”. I don’t know why. Anyway, in PRT terms I meant Indicators.

    Then, my “1 second takes 4 seconds” story is a bit different than what you perceived from it. Although, your option #C touches it. Not that I tried (or am trying) to do that, but it could happen because the processing takes too long. For example, of you would calculate the average of 1 million Array entries, that may take a minute or much more. And if your Strategy code of 1 second tries to process that each other second … it just can not be.

    If you recognize that the calculation of your Indicator takes 6 seconds on 10000 bars, the calculation of one bar would roughly take 6/10000th of a second. That can easily be done in one second.
    Would your program be so heavy on the calculations that ne call takes 1 minute to process, then (ProRealTime won’t be happy because you are killing their server(s) and) this is fine with bars of one hour. Within one hour 1 minute of processing can be done.
    This is all obvious now, right ? Yes. But :

    and constantly use 10,000 bars of data to get the value I’m looking for

    if that is to, it will consume 6 seconds at each new bar (per 1 day, in your case).
    So if it really takes 6 seconds, this is a lot of processing time.


    My computer does a lot of whirring when that’s happening, so it sounds like its processing locally, and not remote

    I would say that no local processing exists, but always need to ask the question to Aussies whether they use the PRT-API, because it exists, and for sure this has been used in Australia. If that is so, then all is processed locally after all, and from my latency math nothing much will be correct (you would probably end up with a latency of 2 seconds all together (until the trade is at the exchange).
    Maybe someone can tell whether the ticks in the Indicator code *are* being processed locally, because sometimes I have that sense about it. This would mean that Indicator code is processed locally as well, but which IMO can not be because in that case Indicator code called from the PRT server running the Strategy code, would not work out well. What surely *is* processed locally, is the plotting; this is obvious.
    And because the tick data arrives at your PC anyway, but now to maintain charts, may heat up your laptop and start the cooling little fan.


    B – Will my trade price then be a lot further away from the open then in term of time executed from open time, because of how long it’s taking to get to an answer, before it decides to buy?

    Most certainly, Yes.
    I like to refrain somewhat from your said “open time” because it is just about the price which existed at some stage. This “some stage” stage is at the end of the previous bar. Thus you are correct – when your program takes 1 second to calculate, it will give the Market Price (so that assumed) to the broker to deal with, one second later than you intended. Not good.
    On another quite crucial note, if I tell that 10K ticks (which is Asks and Bids) occur in one second – but make that 100 ticks in quiet times like at this hour around our (Europe) noon for USA still sleeping times, and the price may or will still rise or drop one point or more (step size of Nasdaq is 0.25 points) per second.
    FYI : From here, latency via IBKR to Chicago (the exchange) is 400-500ms. From France, where the PRT servers are, it will be not much different (plus assuming the IBKR servers are in Switzerland for us in Europe). The fact that you are in Australia, does not matter. For IG all is moot (for me) because of what I know there won’t be an exchange in order, and latency thus can be better; I assume the IG Servers reside in the UK and one-way latency from France could be 50-100ms.

    I think it is always best to have a shortest running program code as possible, so your (Market Order) price will be as close as possible to what your program sees from the close of the previous bar. Notice, however, that whatever your program code reports to you (read : to itself) will already lag because of the way to you (read : to the program). Thus, when the IG server reports the price, and one way latency of e.g. 100ms occurred towards France, prices (like Ask price) have changed a 100 times, if not 1000s of times (e.g. at the opening of Nasdaq at 15:30 Amsterdam). And *then* your program has to run and *then* your program is buying and it is doing that after again the 100ms now towards the UK. And then the price has changed numerous times again.

    But you told that you trade with Daily timeframe, so you won’t be bothered by that. Other people might, though. And since you asked … 🙂

    Regards,
    Peter

    #235290

    I tested my snippet above also on a 10-tick and 100-tick chart, there’s no change, every single tick the array grows.

    Thank you very much, Roberto.

    #235291

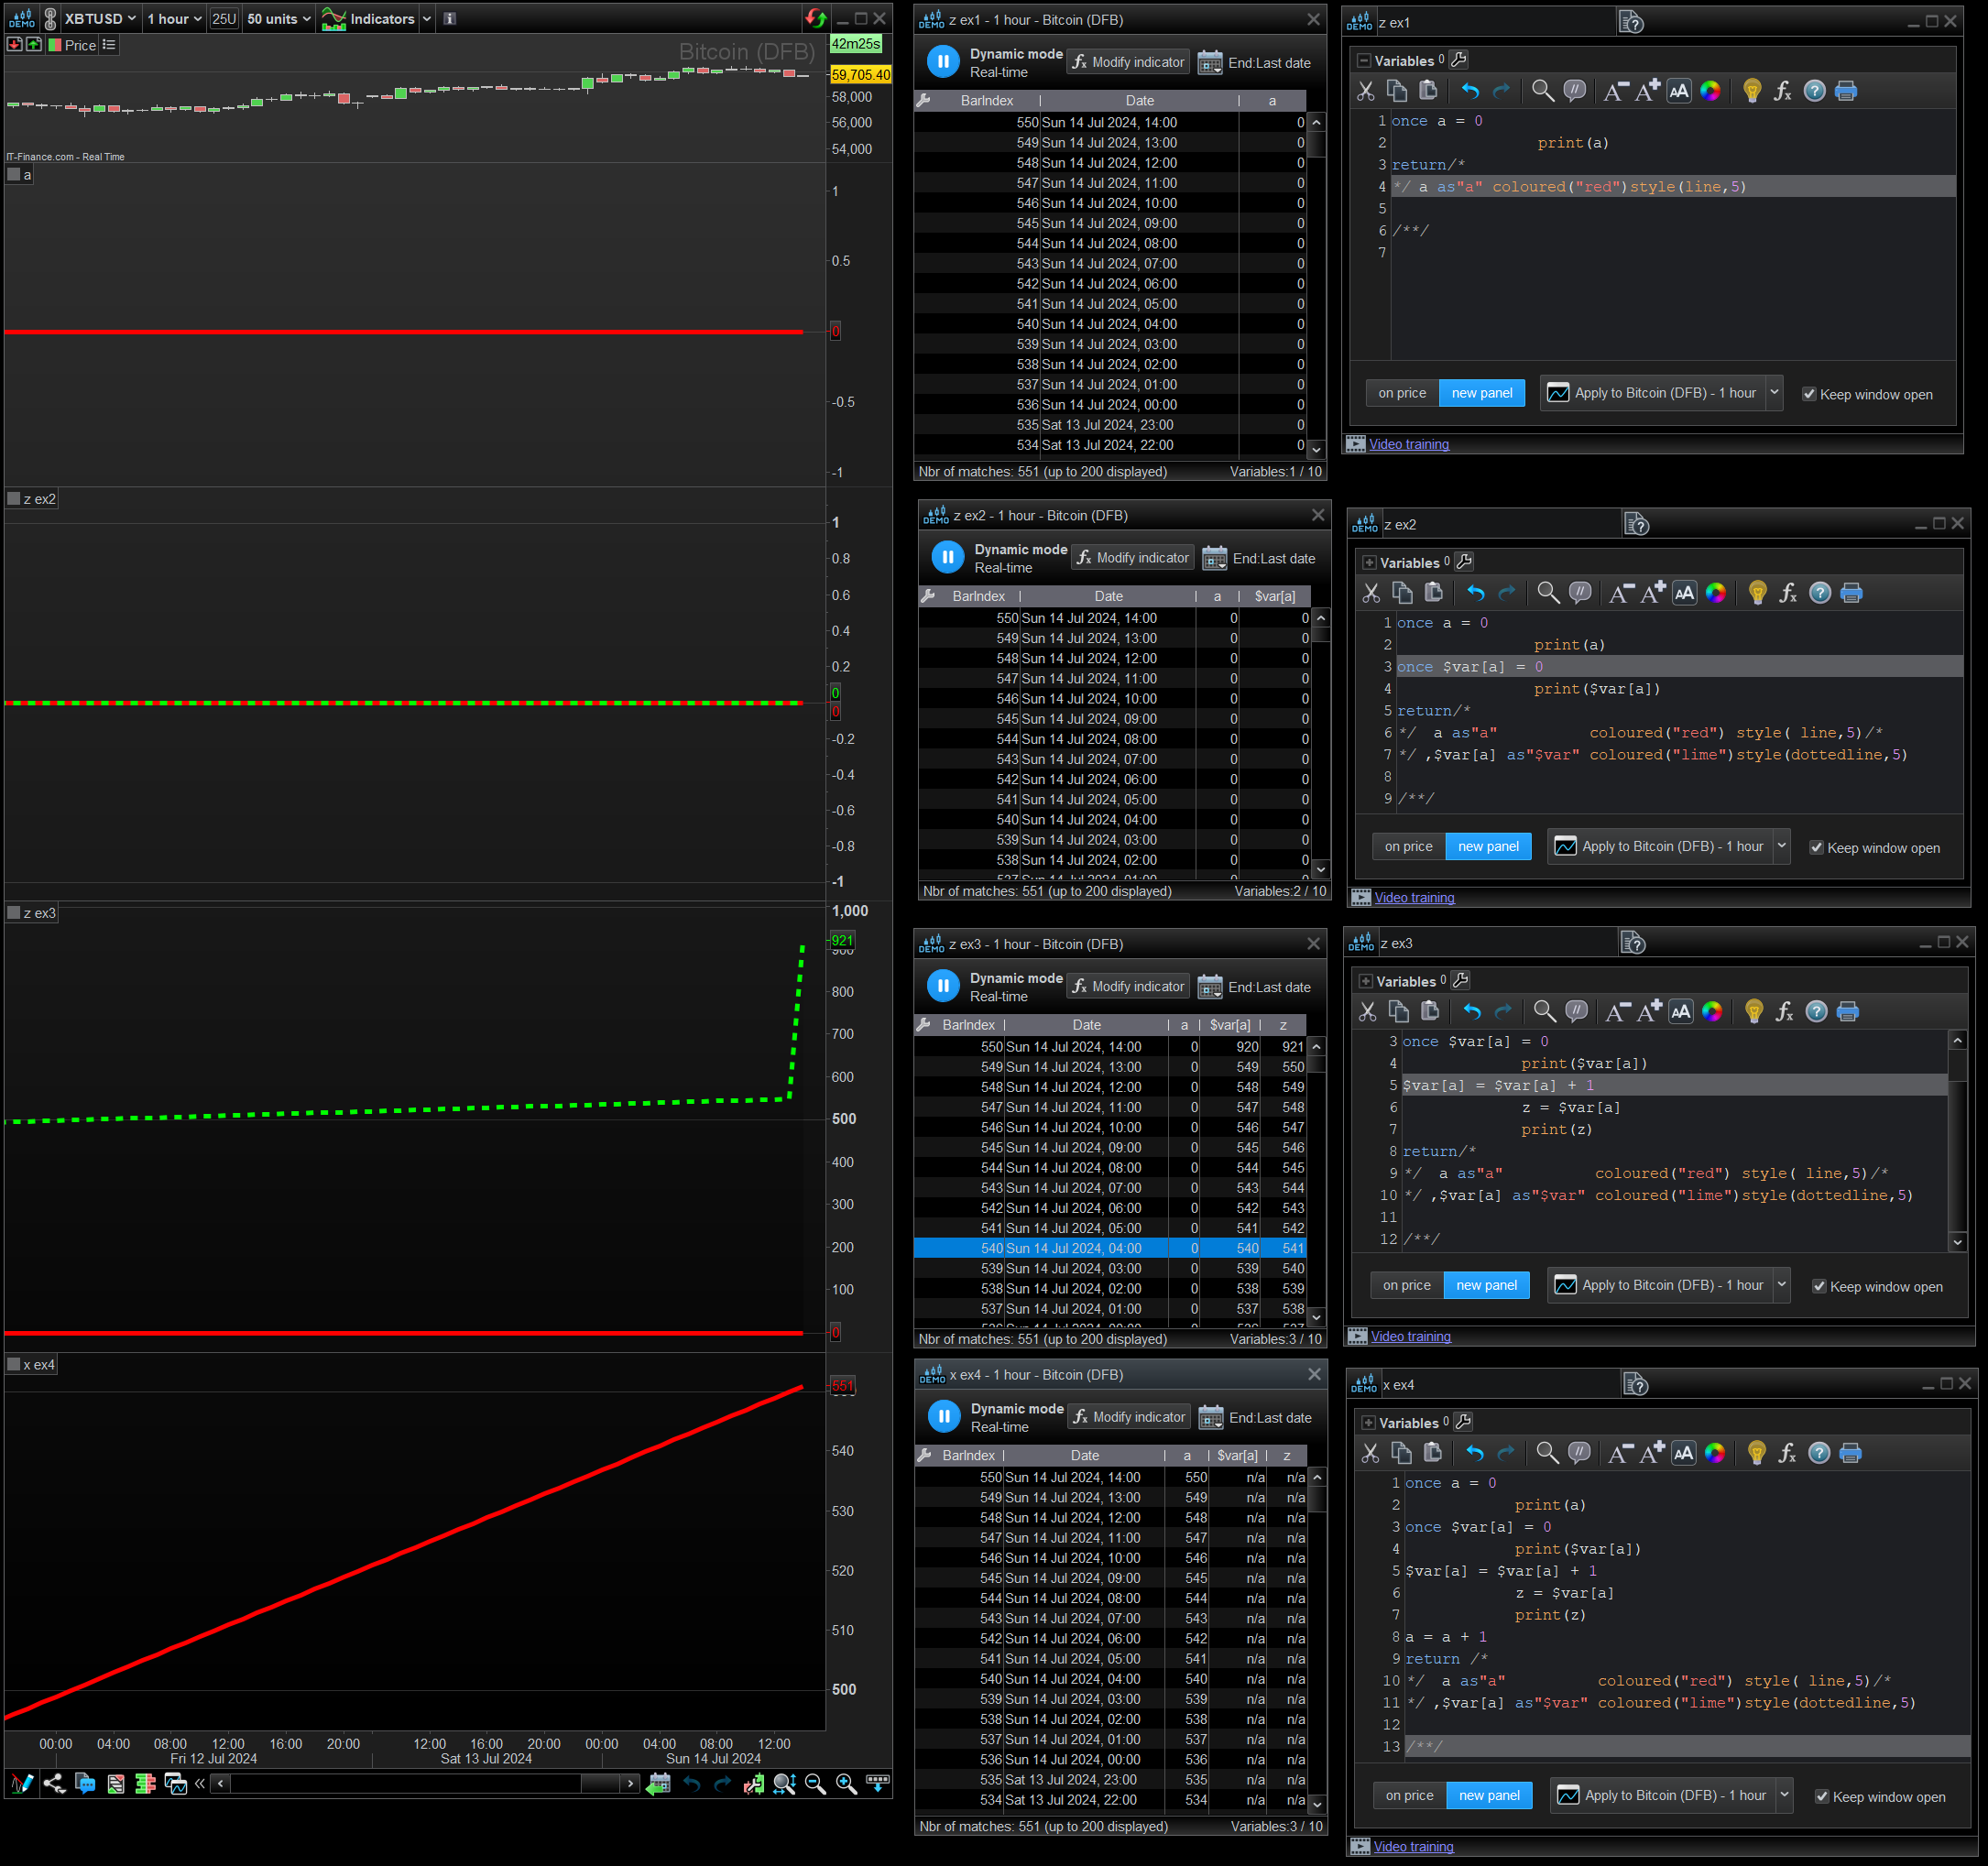
    @PeterSt from some of you earlier comments

    “Doing things in a loop to retrieve ticks (tick values) is not going to work;”

    This is what I found while creating a multidimensional array using loops. The values were different to what I was expecting. The values at the time, appeared to be related to the tick values. Further analysis confirmed they were, kind of, but, multiple elements of an array had the same value and some values were missing. In conclusion I put this down to the execution time of the iterations of the loop driving ‘when’, in time, the array index changed. Also, the size of the array was linked to the number of iterations loop set at.

    Following on from that, the earlier a=a+1 example, appeared to show a way of possibly creating an index value based on the signals/ticks, maybe independent of the loop execution time, since it wasn’t in a loop.

    ” I am not saying that you confuse things, but it is easy to be confused when looking at the several “dimensions” which may occur. A few things on this :”

    I’m in agreement here, I consider myself a newby at best. That means I’m unable to see the big picture, and at best looking at a small area of nuts and bolts. Other having a bigger sight of the picture may see the relationships of certain things interacting, where I may not. However, comments that go over my head are good because it gives me insight to look at areas I wasn’t aware of, or challenge my current thinking on an area.

    From a different dimension point of view, I see three dimension at play at this level.

    BarState as I called it, barCall, and the call of strategy code, I think you are, only happens once a bar, and is when the bar ends and the normal variables current values are historicized etc. These values become fixed, has you describe. The only way around changing when this happens, is to move to a different timeframe which offer that level resolution. Period.

    I’ve not attempted to do strategy code on any tick chart, i’ll look at that, no comment.

    TickState as I called it, and signals, you referred, as I interpret it, is the movement of ticks on the 1 tick chart. These affect every timeframe as the updating of the current close price. The last received tick is the close on every timeframe.

    “you can not store data per tick.”

    Because of the barstate/barCall execution of the strategy code, only one value per normal variable can be stored, so multiple ticks could not be stored in a normal variable. However, that’s were arrays are useful, carrying their element values across the barstate to the next bar.

    The third dimension, i’m calling executionState, This would be the time the code lines take to execute. Now unlike barState, the code appears to somewhat run, or more likely variables are update with the tickState tick, more than once. I assuming here its triggered by the TickState when a new tick change happens. However in a loop, the loop execute the iteration as fast as it can in time. The execution of the code creates a small delay, which can increase substantial more when loops are used.

    “And what I was suddenly seeing in my previous post, is that an Array element could persist its given value per tick in the Signal code after all. And what it requires is looping through the array in the calling TIMED Strategy code and add its values in order to prove it.”

    This is where I’m at with it, if you can create a tickState signal to drive array indexes, the values stored in the elements are carried across the barstate to a new bar. Because the latest tick represented the change the current timeframe close value, the same ticks are avaliable on all time frames.

    Now i’m not saying this would be generally useful, however it could be possible, the application of it, I don’t know.
    Just to speculate, you could say display 5 minute candles on a hour chart, however ,you couldn’t plot using the x-axis 1hour time base, but could create a basic mini chart window using the draw/anchor commands.

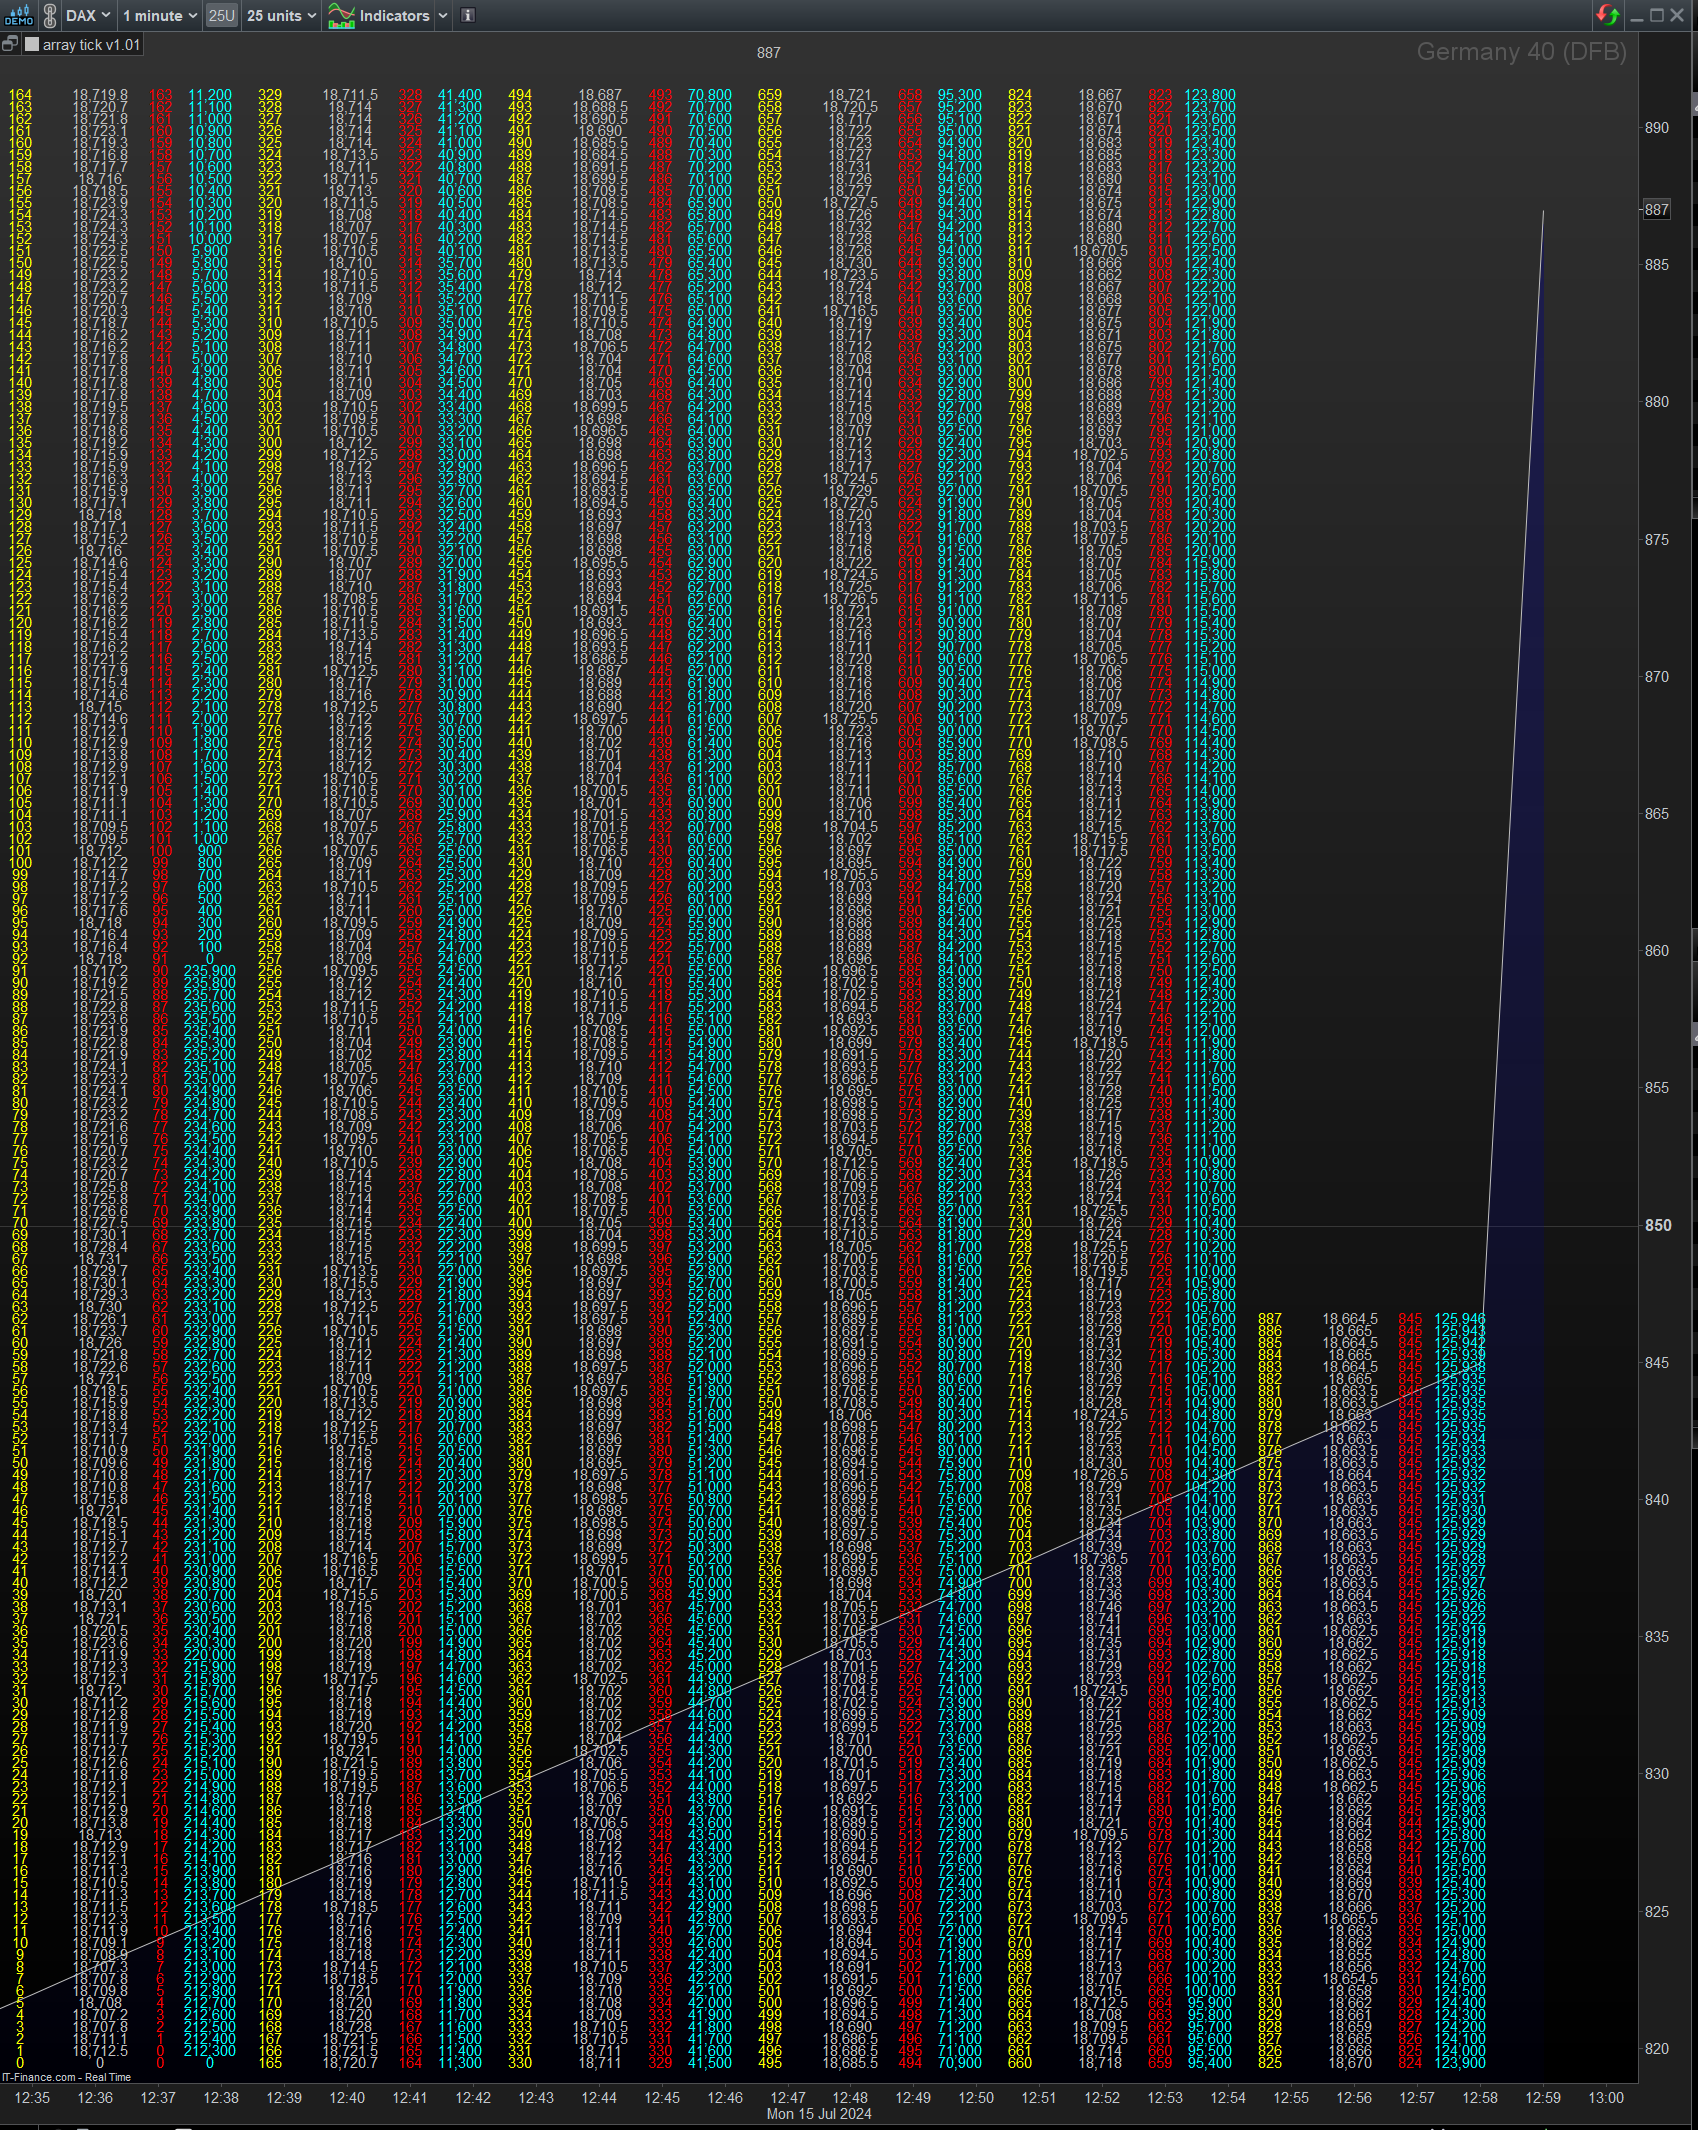
    I knock up a program to see if the tick values could be capture in an array, based on above. See image.

    The columns, yellow = array index, white = tick value, red = TF barindex, blue = time, these value are represented at the time of capture.

    “Only think I have come up with is, the chart build is retrieving one value per bar, and after, its updated by the ticks. in real time.”

    Looking at the barindex and time values, it appears to prove the one value per bar at chart build.
    Also example, is 1 minute chart, on chart build the seconds are all ’00’ as expected for 1m, and each value is associated to one bar.
    When chart is built, this changes, multiple ticks per bar and the seconds change with ticks.

    The line of the graph shows change between, chart build and real time, moving from a linear change to a acute change in angle.

    I’ve not scrutinised the data in depth but, appears to hold up at first glance. How this can be processed needs further work!.

    The code file, lists the data.
    The list can soon run off screen depending on window size, larger window better, along with, maximise panel and full screen.
    The variables ‘c’ column length can be changed to set the number of rows displayed in a columns to fit window.

    When off screen re-adding the indicators reset to default bars, 25 units keeps start bars to 500-600 where list may be short enough to see end.

    The sole number at the top, is the current max size of index value of array creating the indexes for the other arrays..


    1 user thanked author for this post.
    #235293

    Things have move on since started writing my last post.

    On a lighter note Roberto’s comment,

    I am not sure I have  completely understood what your topic is all about

    had me in stiches, that’s probably the only thing we could agree on. Ha Ha.

    Regards all.

    #235299

    I consider myself a newby at best.

    Maybe you should not say that ! …

    Please notice that your next challenge is to use what you just showed in Strategy code. In other words, what you just showed is not so difficult to show BUT you used the proper way (arrays) of getting there. So the next step is (surrogately) do something like that from within the Strategy code which calls the Indicator to build the data. I mention “surrogate” because you won’t be able to show all that data (I think). But you could prove to yourself that you can use it. For example, add all prices and divide by the number of them and show *that*. Or, show the total you counted per timed bar and the average for *that*.

    Next up is the Volume Profile. Don’t tell anyone. 🙂 🙂

Viewing 15 posts - 226 through 240 (of 247 total)
Similar topics:

Create your free account now and post your request to benefit from the help of the community
Register or Login