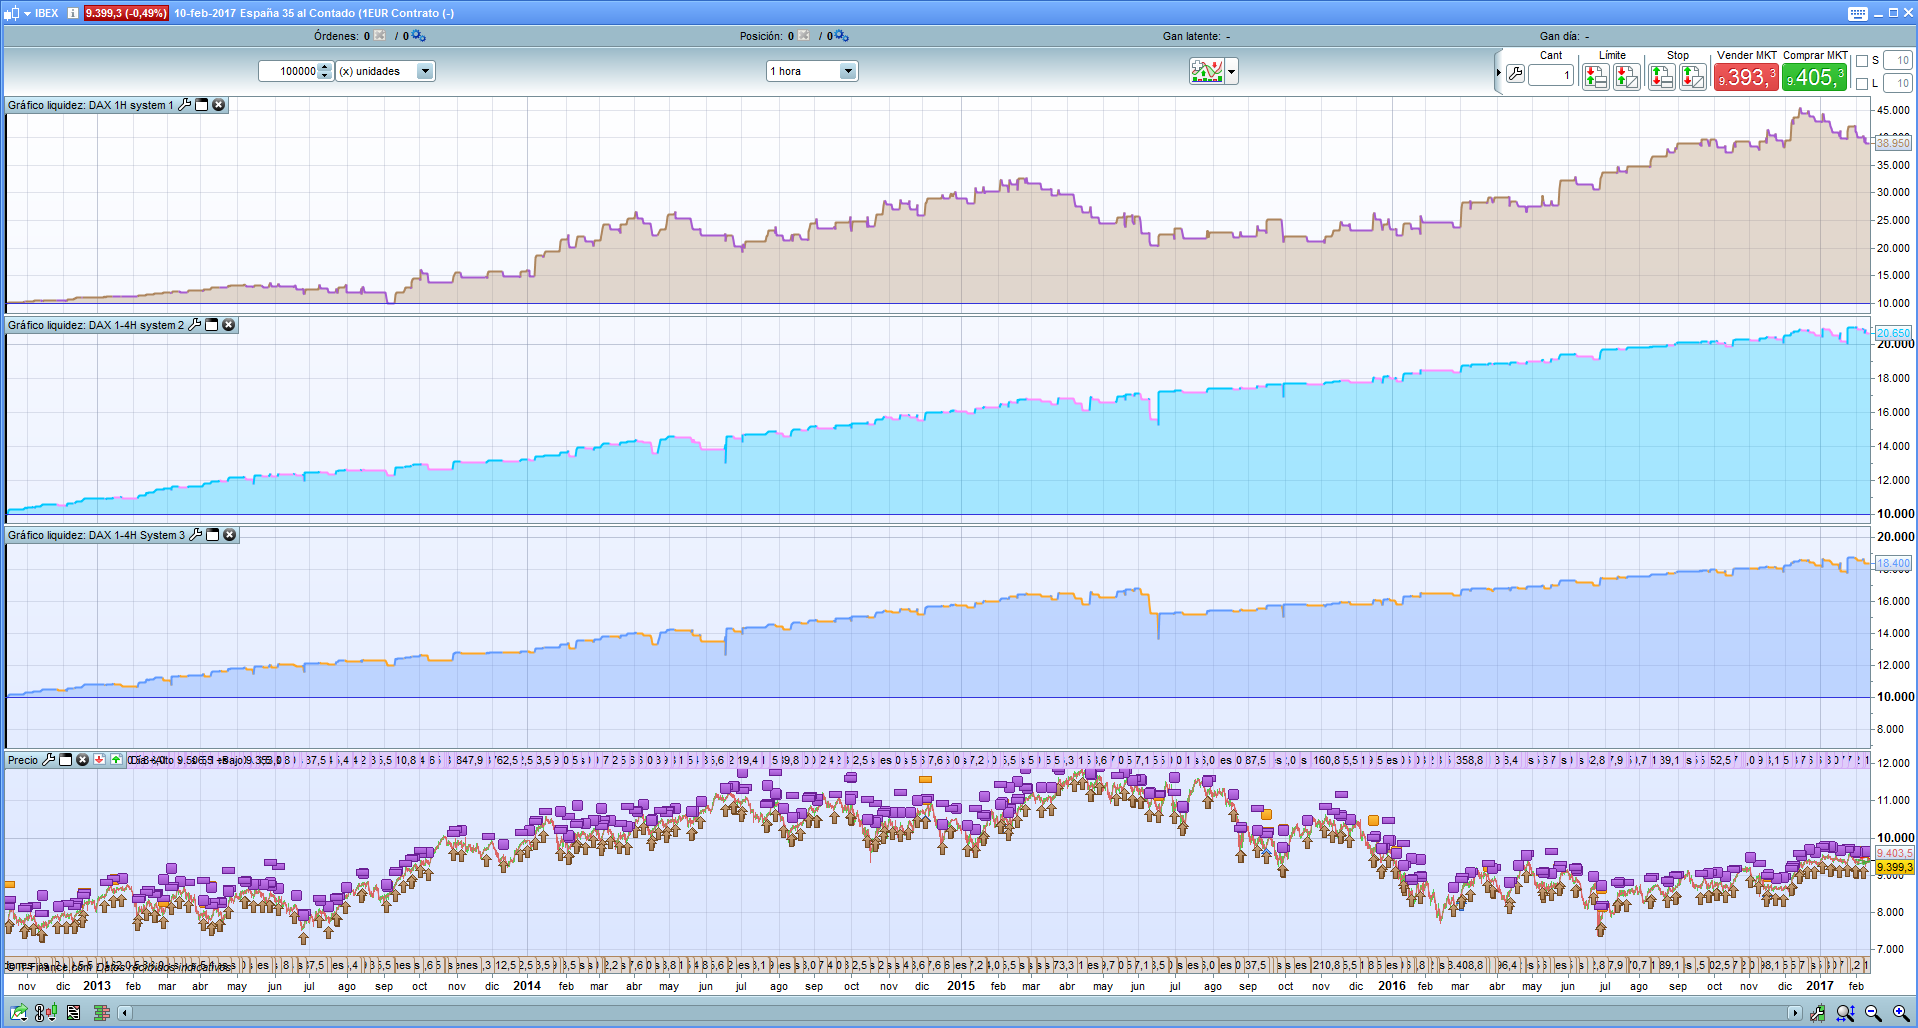
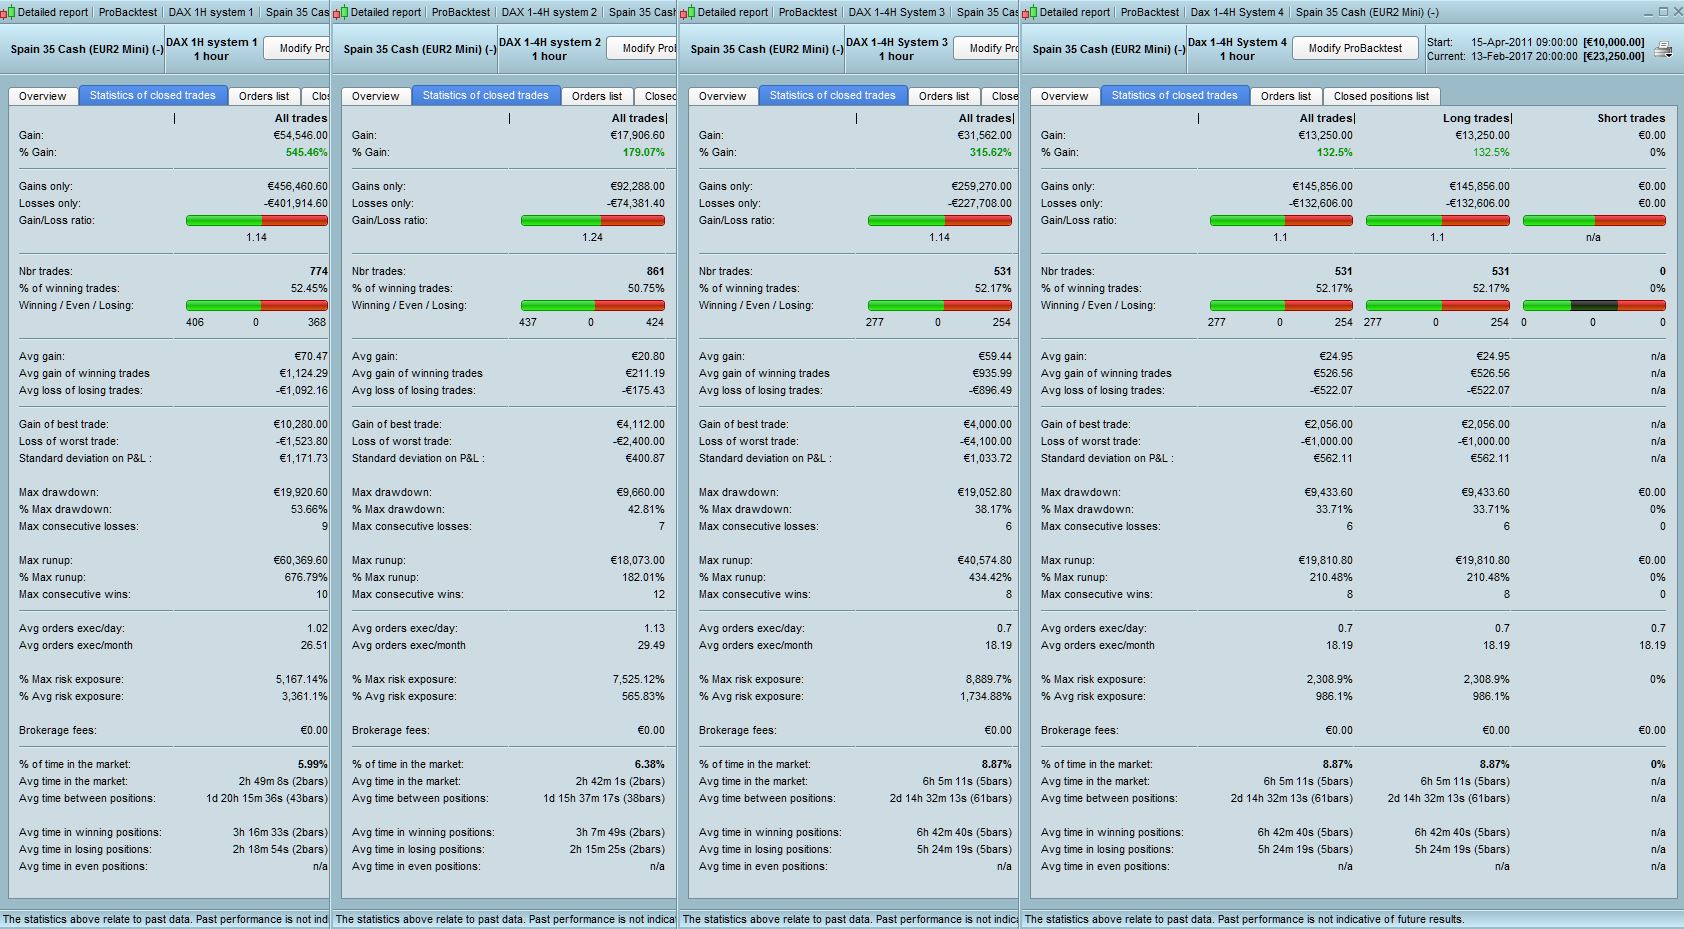
Hello, attached image of systems 1,2,3 on ibex. Spread 3 points. Same take and stop. Works fine, but I do not trust the martingale, it is limited to a maximum of repercussions in the code, but it still seems risky, what do you think? If I replace ordersize * 2 by ordersize * 1.5 it is less risky.
Hi – good work on the Ibex, looks good, though interesting that in this case system 2 seems to perform better than 3. I too am wary of using pure martingale to make up losses. Those periods in June 2014 and 2015 where there is a big draw makes me slightly nervous as the only reason it works is because you recover the losses quite quickly. But if you ever come across a market where you have a run of losses (and you will eventually), it becomes difficult to stomach. Yes, reducing the multiple to 1.5 will help so we should try that. If there was a way in PRT that showed us a histogram of the max consecutive losses to show how often 1,2,3 etc losses in a row occurred we could use that to see what sort of skew it presents, will need to do this in excel though.
Other options could include using the ATR (maybe make the stop/limit a % of the ATR) like Nicolas mentioned earlier, this should in theory also increase profits as the index grows in value. Am not sure quite yet how to incorporate the code but will try later. Also, I am going to have a closer look at those June periods to see if there is a way we can limit draws during events like them, that may yield some info.
I am thinking, maybe there is a middle ground here. We have in our cabinet a variety of systems tested here so we start off with a less risky, more stable equity curve with a low draw ie. chose a low risk system. If you have built up enough capital after a period, you can always switch up to the next “risk system” in the scale. This way, you can afford a historically large draw when it occurs but if not, then you also start to increase the trajectory of the profits. The main aim (in my mind anyway) is to avoid a situation where you incur an unexpectedly large draw at the beginning of your strategy and this approach should help reduce that risk. This is all assuming that people are willing to be patient with the strategies of course, there are no “get rich quick” schemes here and if you go chasing those you are most likely to get burned.
@ manel
To see that you think this solution, instead of multiplying * 2, we simply add 1 contract in case of failure, in case of success we return to 1.
DEFPARAM CumulateOrders = true
once ordersize=1

// Conditions

MA1 = Average [1]
MA2 = Average [2]

c1 = Ma1>MA2

t1 = time >= 090000
t2 = time = 180000


d1 =dayofweek = 2
d2 = dayofweek = 4

capital= strategyprofit+3000
n=capital/3000

if n<1 then
n=1
endif

if n>10 then
n=10
endif
if ordersize>10 then
ordersize=10
endif

indicator13 = MACD[12,26,9](close)
c13 = (indicator13 < 30)

indicator11 = ExponentialAverage[20](close)
c11 = (close >= indicator11)

indicator1 = MACDline[12,26,9](close)
indicator2 = ExponentialAverage[12](indicator1)
c12 = (indicator1 > indicator2)

If   d1 And t1 and c1 and c11 and c12 and c13 THEN
if not onmarket then
IF PositionPerf(1) < 0 THEN
OrderSize = OrderSize+1
if ordersize<1 then
ordersize=1
ENDIF
ELSIF PositionPerf(1) > 0 THEN
OrderSize = 1
if ordersize<1 then
ordersize=1
ENDIF
endif
buy ordersize+n Contract At Market
Endif


If d2 and t2 then
sell at market
endif
endif

Set Stop Ploss 50
set target pprofit 50
thanks for ibex .
why not manage ” n ” with ATR daily ?
i mean atr of last days .
or other volatility indicator ….
or maybe :
n = max ( 1 , (round ( atr[10] / 2 ))
for example .
more volatility increase ” n ”
less volatility reduce ” n”
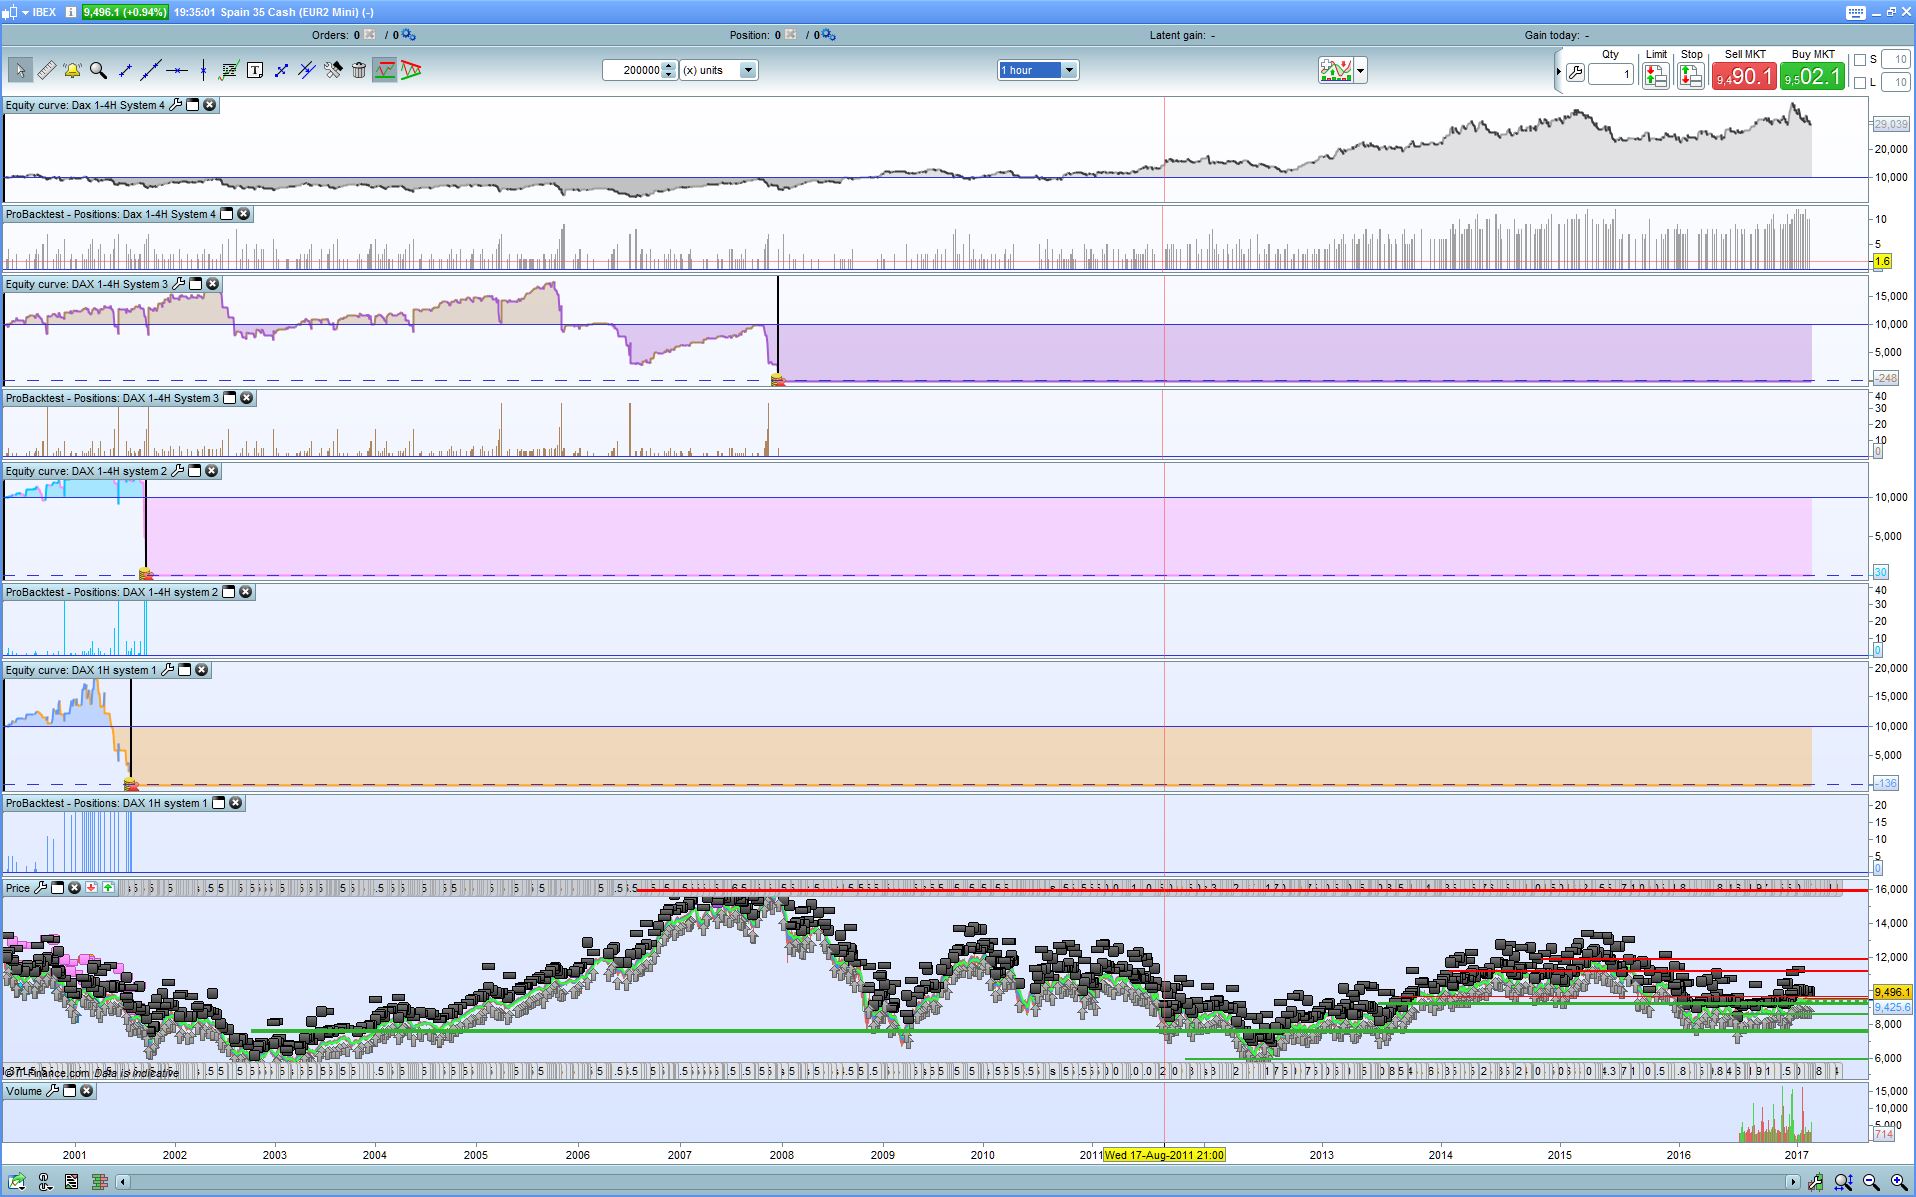
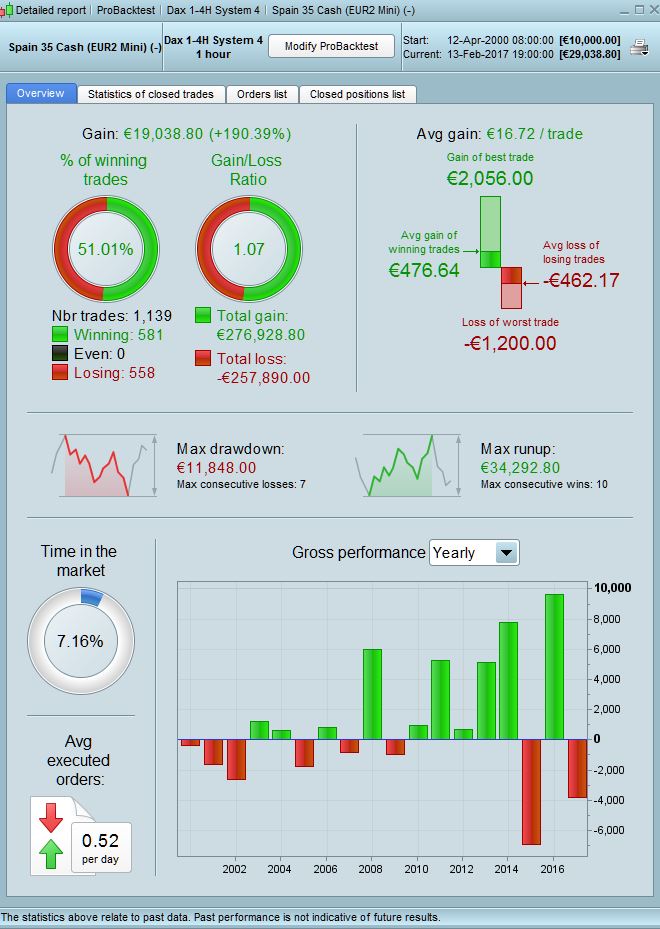
Hi Raul – I’ve done a test of the above code (called it System 4 as I think it’s worth keeping for the future) on the Ibex with a 3pt spread. I think this is the sort of idea we can work with and develop as it is definitely less risky than the rest. See results attached. I have done a backtest as far as PRT will allow which is from 2001 just to get an idea of how effective these systems are over the long run. Be aware that this is on the Eur 2 mini contract, 1hr, with tick by tick off.
1)It does not start making any money until 2011, so 10 yrs of zero profits.
2)However, all the other 3 systems lose 100% of their capital at some point before 2008, so they do not even survive 10yrs
3)During those barren 10yrs, the draw is only 22%, which is acceptable.
4) Overall the draw is 35% which I think is quite high but not disastrous
5) Zero bar totals are 25% of the total trades and a similar % of the total profits (+8.2k) so not too bad even if we ignore these and in line with other results we’ve had before.
6) Performance is a bit erratic and not consistent as the years go on
Overall, this risk reducing system does do what it is supposed to – i.e survives a big draw in pretty much all market conditions. It may not be ideally suitable for the ibex though but this (or a revised version of it) is on the right track in my opinion.
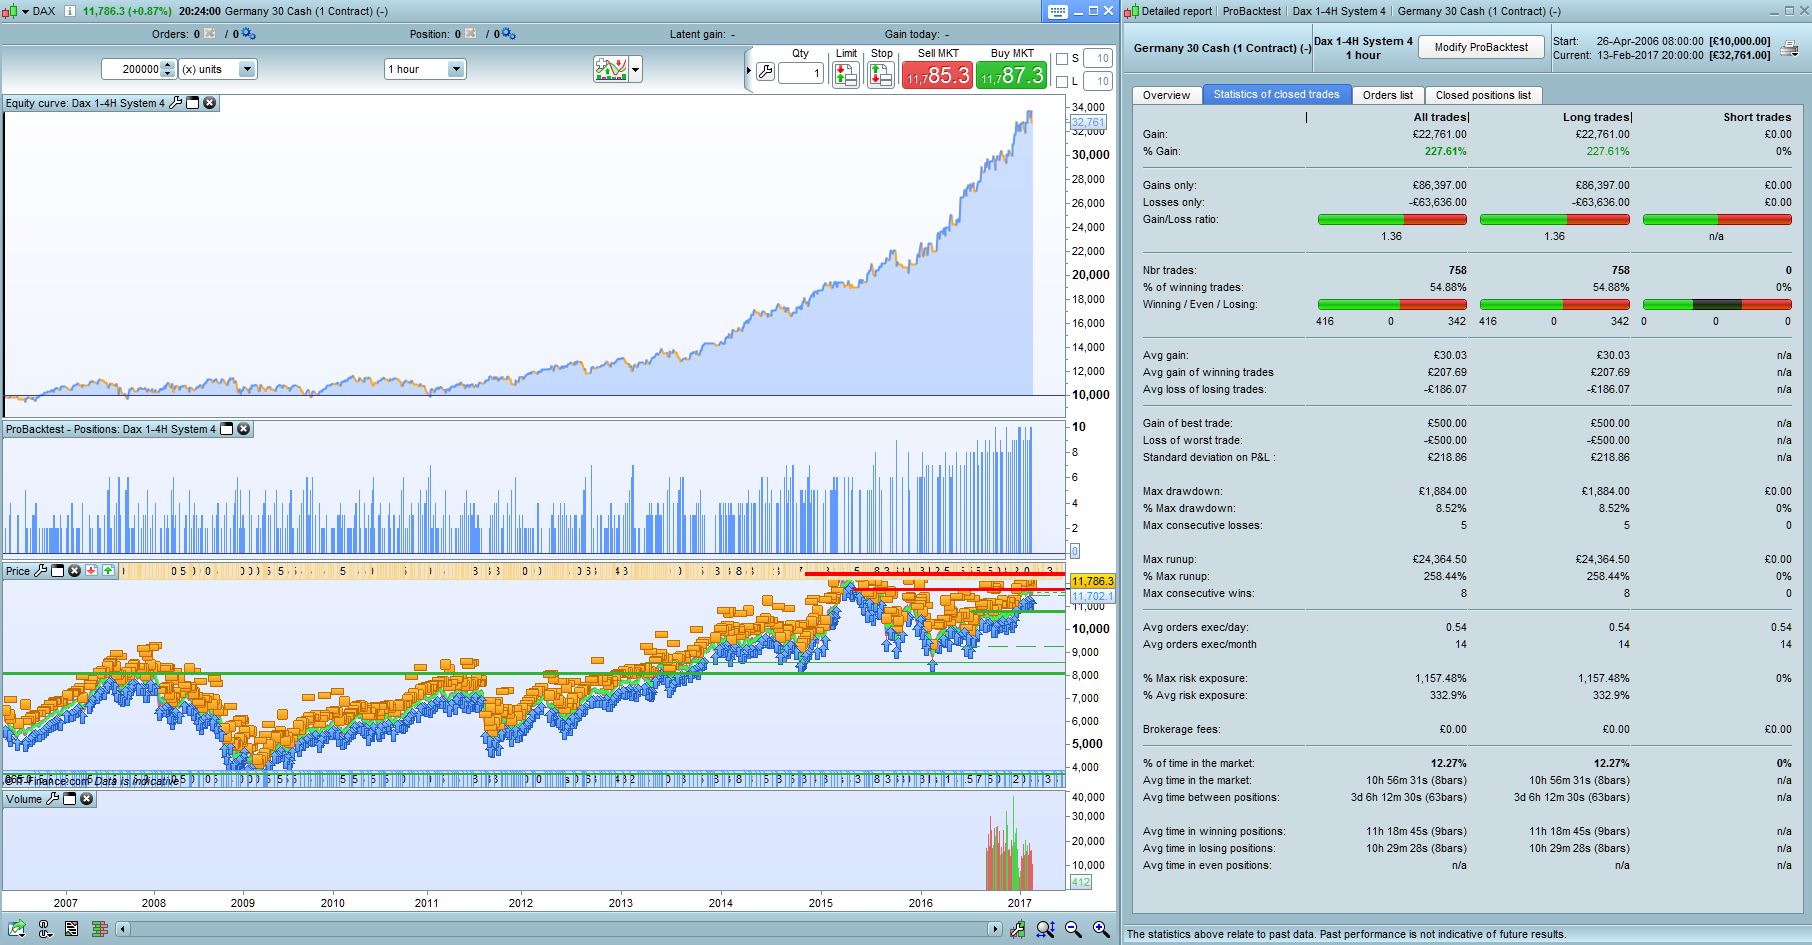
Hi manel, thanks for the information. Could you attach the system 4 (plus 1 each time it fails and return to 1 when it hits) on the dax to see how it comes out over 10 years?
I have backtested last 5yrs of Ibex with tick by tick turned on to produce more accurate results and it comes to the same conclusion – the draw of System 4 is the least @ 34% compared to the rest so it has reduced the risk as expected.
And the system 4 on dax over 10 years?
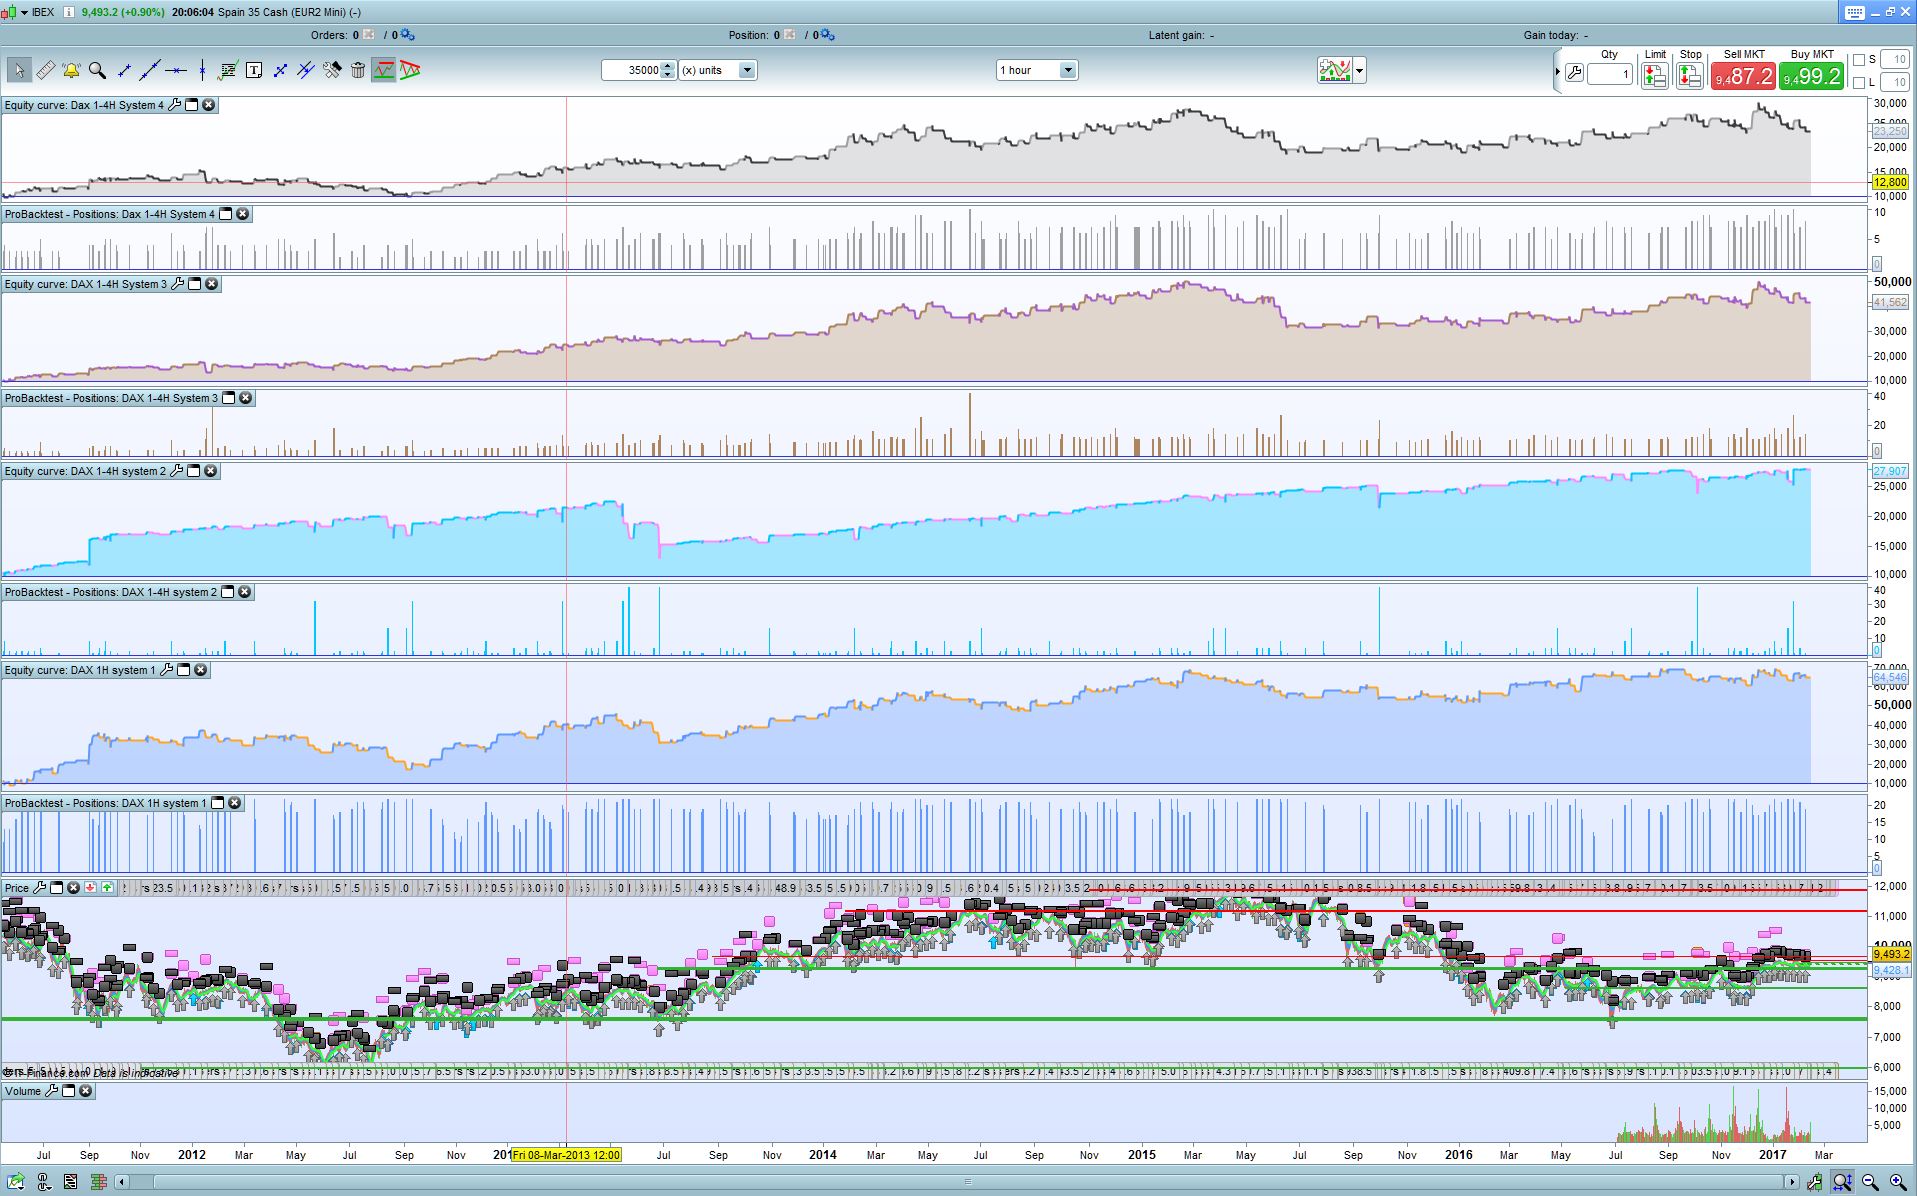
Here you go. Dax 1hr, System 4 with 1pt spread, over 10yrs. Looks pretty decent with only 9% draw. Only starts performing from 2012 though, prior to that the first 5yrs were pretty flat. Zero bars totalled net -378 (ie very small, no adj really needed to overall profit results).
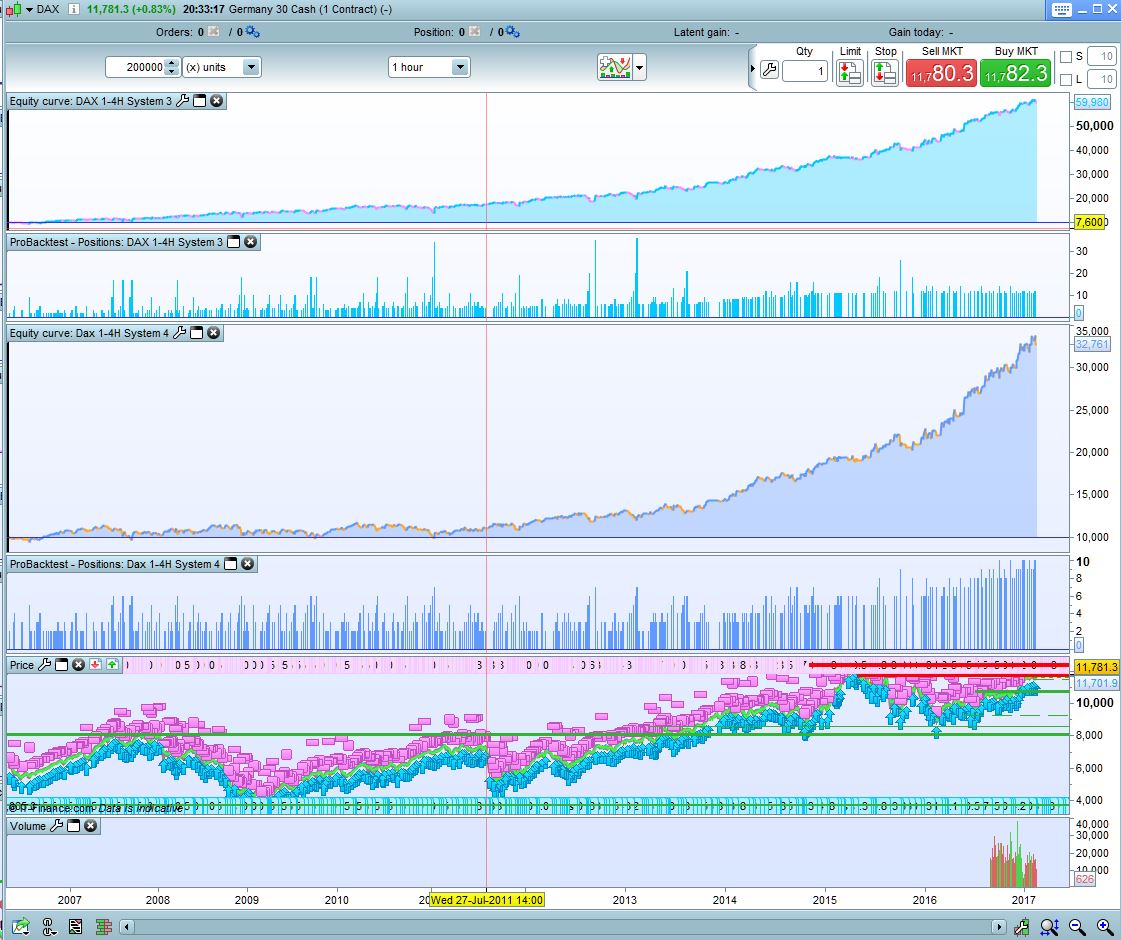
And here is the comparison of system 4 with system 3 (which is our preferred one for the dax). As expected, the results are very similar but the position scaling of system 3 means that the overall profits are more than double but the draw is almost the same (8% vs 9%).
I think next step is to perhaps code a strategy incorporating the ATR as suggested by Nicolas and Paris and see if that throws up any more interesting nfo.
In the meantime, I am going to go live with System 3 on Dax and CAC from tom as since it only trades on Tuesdays, we have limited opportunity to test in live conditions as it is. Will keep an eye out for any discrepancies between live and testing also and post back.
hi guys
yes atr can offer a fast indicator of seasonality …..
i mean low atr , low volatility
high atr ,high volatility
always in august there is no volatiliy , but if we for some reason have volatility , a high atr will tell us . better than statistics ….
we have two ways to study it
high volatility —-> we reduce n and low volatility —->we increase n
but also
high volatility —-> we increase n and low volatility —-> we reduce n
and compare the results .
no idea what will have best results and if it will make a difference .
DEFPARAM CumulateOrders = true
once ordersize=1

// Conditions

MA1 = Average [1]
MA2 = Average [2]

c1 = Ma1>MA2

t1 = time >= 090000
t2 = time = 180000


d1 =dayofweek = 2
d2 = dayofweek = 4

capital= strategyprofit+3000
n=capital/3000

if n<1 then
n=1
endif

if n>10 then
n=10
endif

if ordersize>16 then
ordersize=16
endif

indicator111 = AverageTrueRange[17](close)
c111 = (indicator111 > 20)
c1111 = (indicator111 < 20)

if c111 then
nn=5
endif

if c1111 then
nn=0
endif

indicator13 = MACD[12,26,9](close)
c13 = (indicator13 < 30)

indicator11 = ExponentialAverage[20](close)
c11 = (close >= indicator11)

indicator1 = MACDline[12,26,9](close)
indicator2 = ExponentialAverage[12](indicator1)
c12 = (indicator1 > indicator2)

If   d1 And t1 and c1  and c11 and c12 and c13 THEN
if not onmarket then
IF PositionPerf(1) < 0 THEN
OrderSize = OrderSize*2
if ordersize<1 then
ordersize=1
ENDIF
ELSIF PositionPerf(1) > 0 THEN
OrderSize = 1
if ordersize<1 then
ordersize=1
ENDIF
endif
buy ordersize+n+nn Contract At Market
Endif


If d2 and t2 then
sell at market
endif
endif


Set Stop Ploss 50 // from Trade
set target pprofit 50