Bollinger bandwidth indicator with dynamic lines for bulge and squeeze

Viewing 2 posts - 1 through 2 (of 2 total)

  • Author
    Posts
  • #185506 quote
    yomisadikuyomisadiku
    Participant
    New

    Hi All,

    Hope you are well. I am trying to replicate the attached Bollinger bandwidth indicator seen from tradingview and scripted as below:

    A similar indicator on PRT only has the bandwidth oscillator without the marker lines for the lowest or highest of the previous lookback periods. Therefore i have been manually applying the horizontal lines for each market that i am looking at, which is a bit of work.

    I appreciate anyone who can help with the code for this indicator. Let me know if you need more informaion.

    Thank you,

    Yomi

    =======================================

    //@version=4
    study(title = “Bollinger Bandwidth – Bulge and squeeze”, shorttitle = “Bollinger Bandwidth”, format=format.price, precision=2, resolution=””)
    length = input(20, minval=1)
    src = input(close, title=”Source”)
    mult = input(2.0, minval=0.001, maxval=50, title=”StdDev”)
    highlowlength = input(20, minval=1, title=”High Low Lookback Short”)
    [main, top, bottom] = bb(src, length, mult)
    bandwidth = (top-bottom)/main
    short_lowest = lowest(bandwidth, highlowlength)
    short_highest = highest(bandwidth, highlowlength)

    plot(bandwidth, “Bollinger Bandwidth”, color=color.blue)
    p1 = plot(short_highest, color=color.green, title=”Lowest”)
    p2 = plot(short_lowest, color=color.red, title=”Highest”)

    fill(p1, p2, color = bandwidth> short_lowest? color.green : color.red, title=”Background”)

    ==========================================

    Bollinger-bandwidth.jpg Bollinger-bandwidth.jpg
    #185609 quote
    JSJS
    Participant
    Master

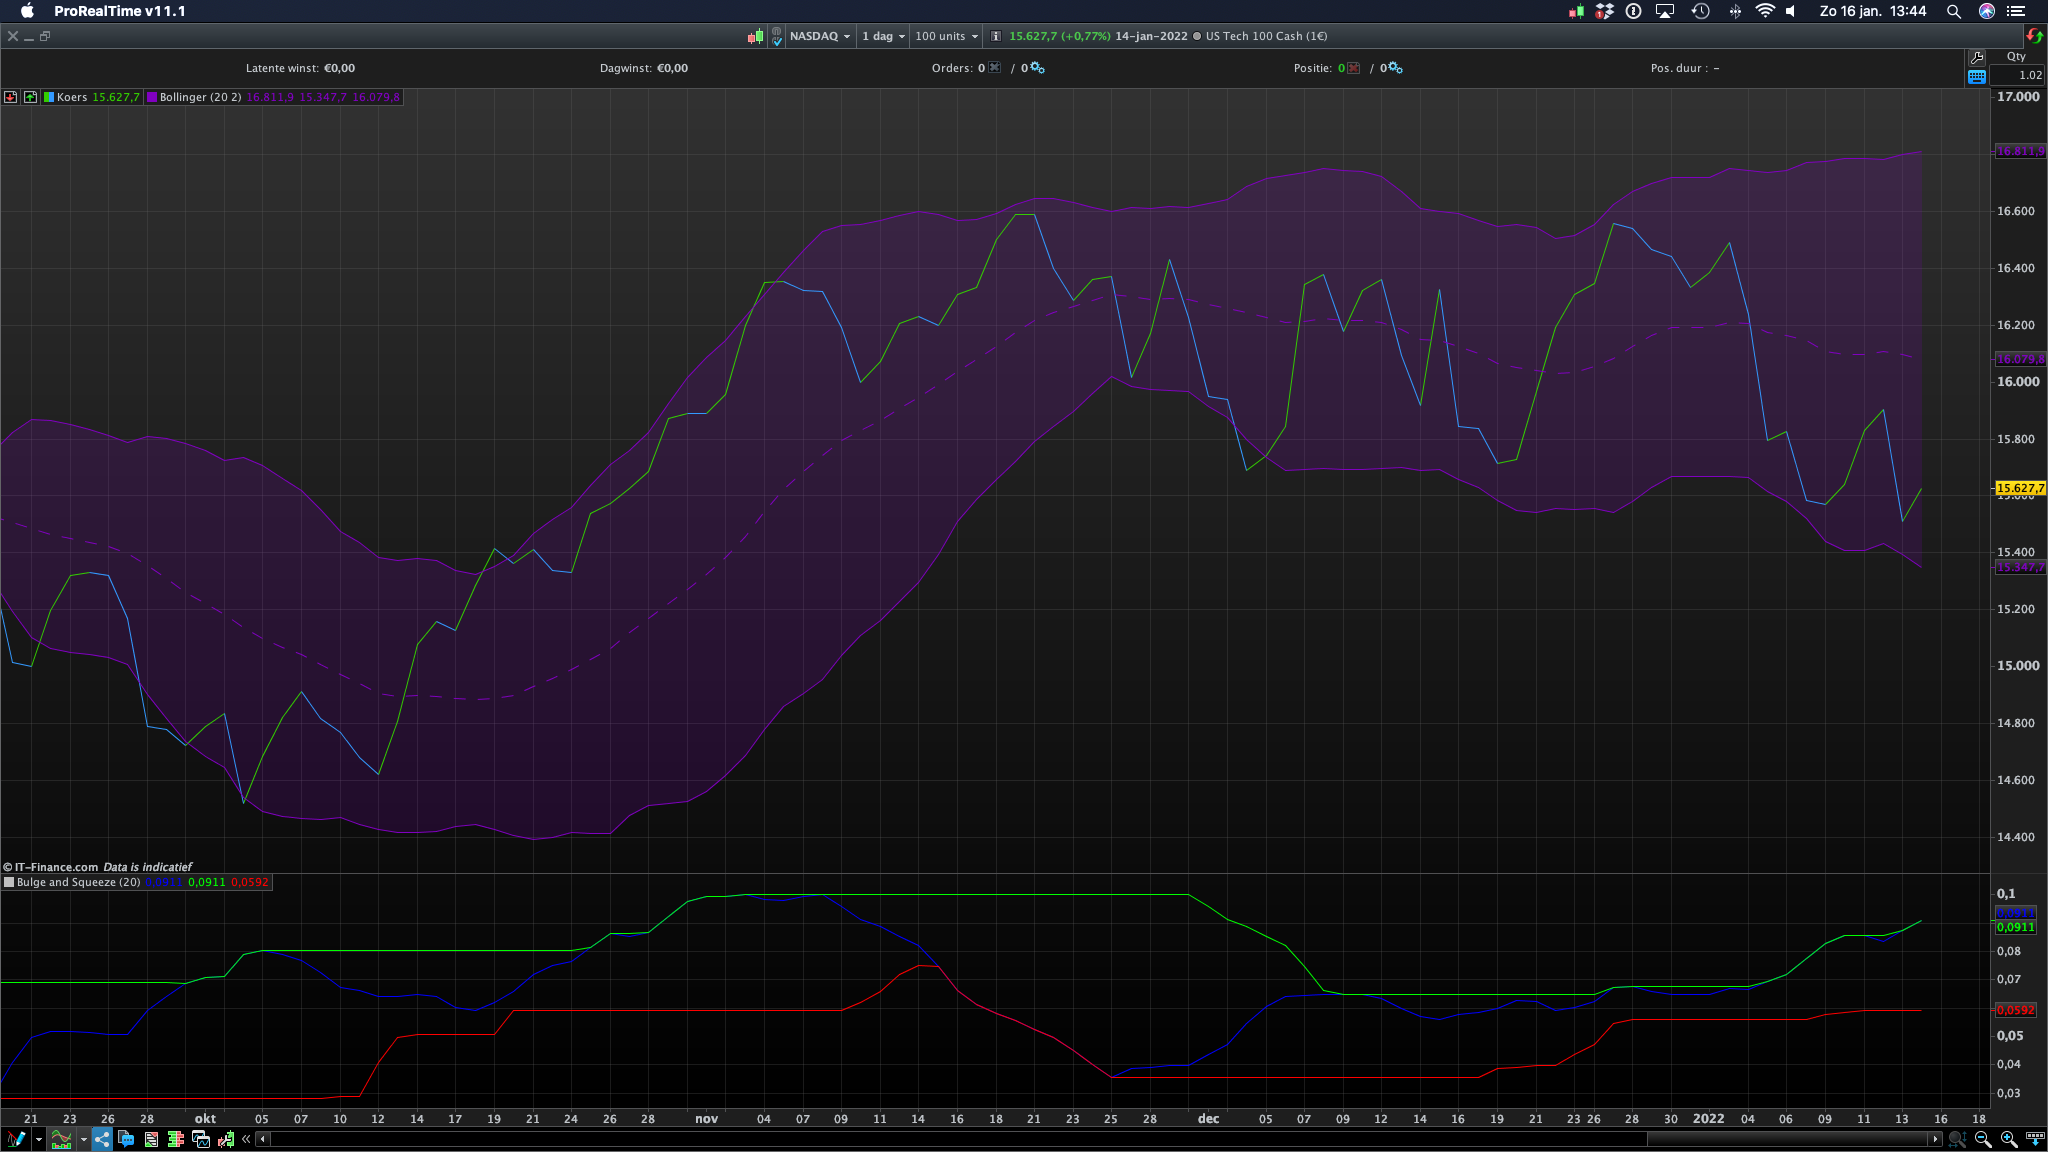
    Hi @yomisadiku

    BandWidth = BollingerBandWidth[Period](close)
    HighestUp = Highest[Period](BandWidth)
    LowestDown = Lowest[Period](BandWidth)
    
    Return BandWidth Coloured(0,0,255) as "BandWidth", HighestUp Coloured(0,255,0) as "HighestUp", LowestDown Coloured(255,0,0) as "LowestDown"
    
    Schermafbeelding-2022-01-16-om-13.44.15.png Schermafbeelding-2022-01-16-om-13.44.15.png
Viewing 2 posts - 1 through 2 (of 2 total)
  • You must be logged in to reply to this topic.

ProRealAI ProRealAI New

Stuck on this ProBuilder code?

Describe what this topic is trying to build, in plain English, and ProRealAI writes the ProRealTime™ indicator, screener or system for you.

Available in 7 languages
Try ProRealAI

Bollinger bandwidth indicator with dynamic lines for bulge and squeeze


ProBuilder: Indicators & Custom Tools

New Reply
Author
author-avatar
yomisadiku @yomisadiku Participant
Summary

This topic contains 1 reply,
has 2 voices, and was last updated by JSJS

4 years, 8 months ago.

Topic Details
Forum: ProBuilder: Indicators & Custom Tools
Language: English
Started: 01/15/2022
Status: Active
Attachments: 2 files
ProRealCode ProRealCode
Loading...