Choppiness Index and Range Trading
Forums › ProRealTime English forum › ProOrder support › Choppiness Index and Range Trading
- This topic has 25 replies, 4 voices, and was last updated 8 years ago by
 Bard.
Bard.
-
-
05/01/2016 at 8:48 PM #6314
No worries, thanks for converting and posting the code for the Kase Peak Oscillator.
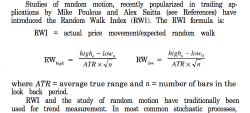
I would add that I think other websites have not understood Kase’s version because:(1) It has incorporated the Random Walk Index code:
(2) The Kase version “also catches divergences often missed by other indicators because it is based on a measure of serial dependency over a look-back length that adapts automatically to the most significant cycle length.”
(p78 http://stocksfirst.com/books/trading-econ-investing/Cynthia%20Kase%20-%20Trading%20With%20The%20Odds%5B1%5D.pdf)
I read somewhere that it statistically evaluates over fifty trend lengths and automatically adapts to both cycle length and volatility.
That’s the clever part about it.What would that code look like for it to be able look back like that?
Thanks again, have a good weekend,
Best
Brad,05/02/2016 at 8:28 AM #6323(1) The random walk index is already calculated at line 5 in my previous code of the peak oscillator.
(2) About the “fifty trend lengths”, if I understand correctly it explains that the indicator would already know how much time each 50 previous trends last? .. that’s complicated and I believe there’s another explain about this. How would the code measure the length of a trend? It’s almost only “visual”, don’t you think? 🙂
05/04/2016 at 12:53 AM #6430Hi Nicolas,
^ (1) Line 5, I missed that, I was expecting two equations for the high and low but of course it can be calculated as one. Thanks.
Kase Peak Oscillator:
(2) The way I read it was that the Kase PeakOscillator finds the most significant Highs and Lows for 50 separate look back lengths of time.
https://forum.mql4.com/39628I think I have found a better explanation from Cynthia Kase herself: http://www.kaseco.com/support/articles/The_Two_Faces_of_Momentum.pdf
Page 5:
“The Kase indicators, rather than using a fixed number of periods, use a loop built into the code that chooses the best cycle length (more below). Also, when volatility increases, traditional indicators often overreact. Kase’s indicators account for changes in volatility and, thus, avoid such overreactions.”
“Both indicators (Kase Peak Oscillator and KaseCD and are based on the Kase Serial Dependency Index where:
ln(H[N-1]/L[0])/V is used for up moves and
ln(L[N-1]/H[0])/V for down moves, where:
H[N-1] = high n bars ago
H[0] = this barís high
L[N-1] = low n bars ago
L[0] = this barís low
V = historical volatility over n bars
N = a number from n1 to n2 that gives the
highest resultant value for the index. “The KaseCD which is like the MACD and is the PeakOscillator minus its own average where the histogram equals
KCD histogram = PeakOscillator – average (PeakOscillator, n.Re your question: “How would the code measure the length of a trend?”
http://www.kaseco.com/support/whitepapers/Kase%20StatWare.pdf
Page 3
“The Kase Serial Dependency Index, or KSDI: What the index does, when looking at “up” markets, is divide the natural logarithm (log to base e – an “existential” number) of the high n days ago to the low today, by the volatility, which is also logarithmically based. The opposite calculation is made for the “down” as shown below. Since volatility is a one standard deviation logarithmic rate of change, we can think of it as a standard of measurement for the market. The higher the ratio of the actual market movement to this measure, the more it is exhibiting serial dependency – or “trendiness”.
Should prices move to about two standard deviations, there is less than a 3% chance that the “trend” will continue and prices will then be expected to revert. (2 Std Deviations represents 95.4% of the data/values in a normal distribution. Out of 1000 occurrences, there is a 46 chance in 1000, or 4.6 chance in 100 that values will occur within two standard deviations. Only 3 values out of a 1,000 will fall outside of the area of 3 St Deviations).
Kase Serial Dependency Index
Volatility = stddev (ln(P/P[1])[n])
KSDI (up) = (ln(H[0]/L[n]))/volatility[n]
KSDI (down) = (ln(L[0]/H[n])/volatility[n]
There are two indicators that are derived from the KSDI, the PeakOscillator and the KaseCD. The Kase PeakOscillator is a sense parallels a simple oscillator which takes the difference between two moving averages. But, in the case of the PeakOscillator, the indicator takes the difference between the up and down indices.
The actual index value is based on an “n” where the number of periods in question, over a range of look back lengths (apparently meant to be 50 lengths), gives the highest returned value.”
I hope this makes more sense now for you? I think this might help explain why Kase was managing huge oil portfolios.
P.s. I have posted more info on the Kase Dev Stop under you original post. http://www.prorealcode.com/prorealtime-indicators/kase-dev-stop/
Cheers,
Brad05/04/2016 at 10:31 AM #6436Also found these variables are used in the Kase Peak Oscillator indicator:
http://www.aspenres.com/documents/aspengraphics4.0/kase_peak_oscillator.htm
Page 4:
Defaults:
Number of StDevs – 2.0
Cycle Range Low – 8.0
Cycle Range High – 65.0
Scaling Factor – 50.0The Cycle Range must be related to Michael Poulos the creator of the Random Walk Index, who discovered during his research that it was best optimized for 2 to 7 periods for short-term trading and 8 to 64 periods for long-term trading.
I hope that this is starting to make more sense now Nicholas? I hope you can figure it out? (-:
05/22/2016 at 12:27 AM #765906/07/2016 at 7:39 PM #8986Hi,
for your information I have coded the Choppiness index and added it to the prorealtime indicators library : http://www.prorealcode.com/prorealtime-indicators/choppiness-index/
Next step would be to find if this indicator is useful or not? 🙂
1 user thanked author for this post.
02/23/2017 at 5:25 PM #2619002/26/2017 at 11:33 AM #2639702/27/2017 at 2:16 PM #2653202/28/2017 at 10:43 AM #2665702/28/2017 at 2:20 PM #26679 -
AuthorPosts
Find exclusive trading pro-tools on 


