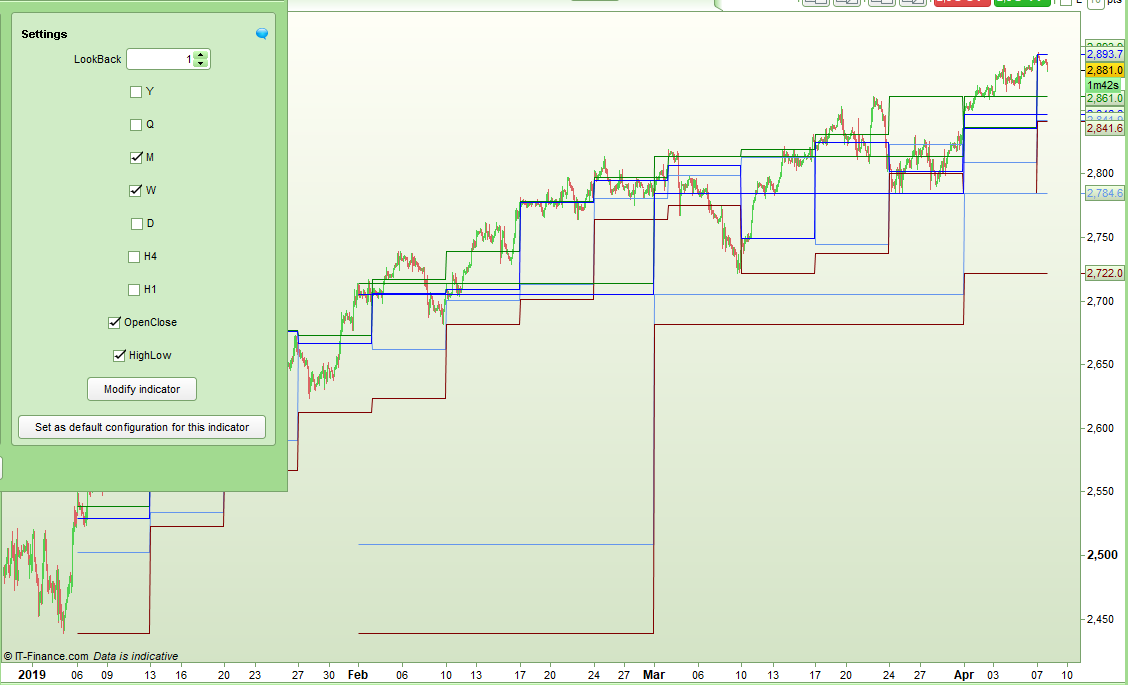
Hallo,
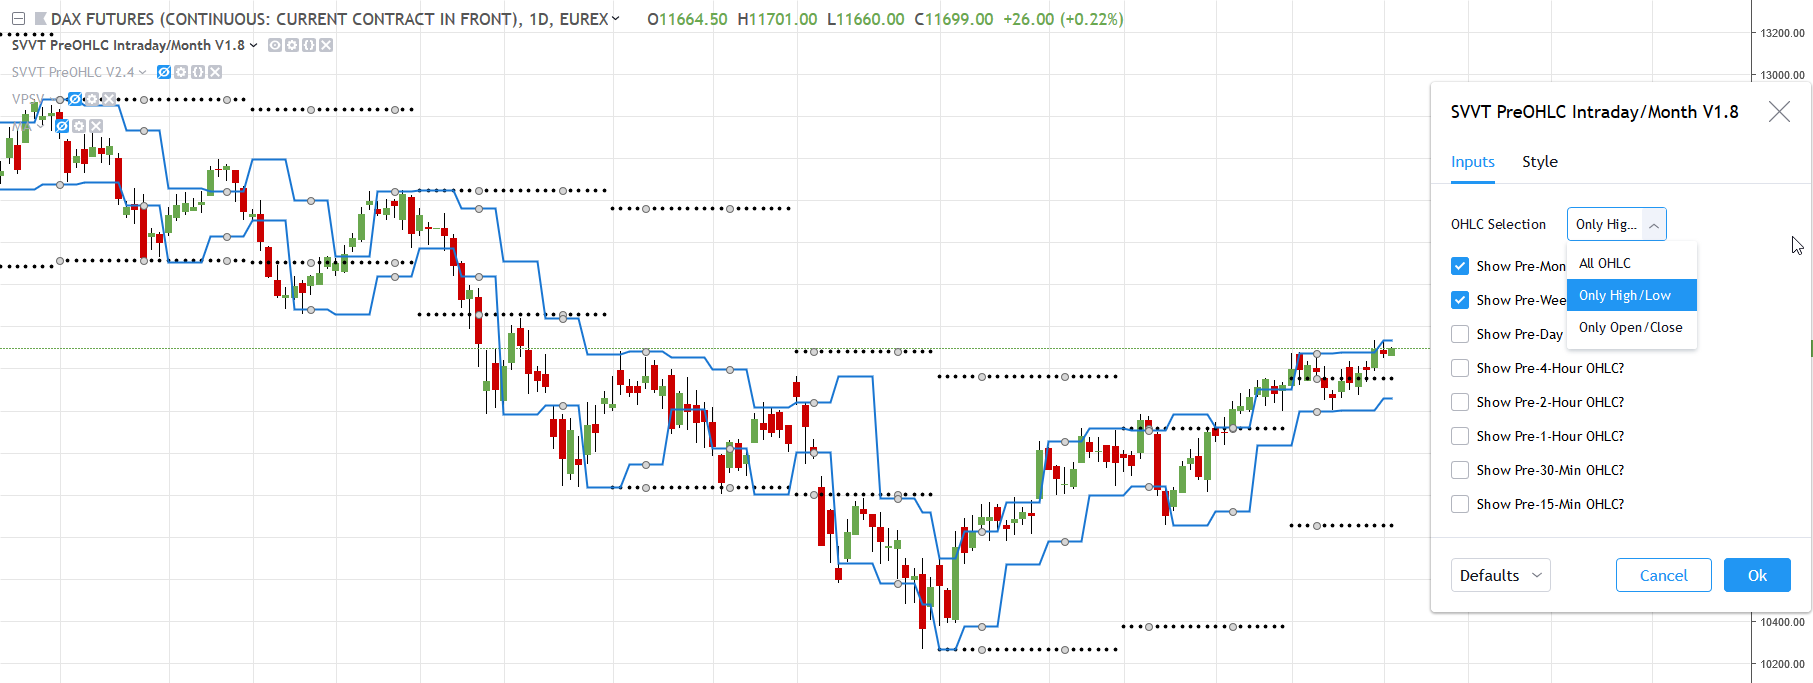
the second script contains previous OHLC values – see attachment. In Tradingview I can select the timeframe for the previous OHLC from 15 Minutes to 1 Month. For example – if i use the Daily chart I can choose to visualize the previous weekly and monthly OHLC. I can also select if I want to see all OHLC, only High/Low or only Open/Close. In the attached picture Week (blue line) and Month (black dotted) previous OHLC are selected and this only for High/Low.
Questions:
Can anyone provide an exact conversion of the code below?
Most important are 1 Hour to 1 Month previous OHLC. A possibility to easy select between the previous OHLC timeframes would be great. If a selection is not possible, also seperated scripts for each timeframe would be good.
I also want to use this as screener – e.g. scan for stocks which are 1 % (variable) in the range of their previous OHLC (Month Low). Is this possible in ProRealtime and can anyone provide this as a screener script?
Tradingview code:
//@version=3
study(title=”SVVT PreOHLC Intraday/Month V1.8″, shorttitle=”SVVT PreOHLC Intraday/Month V1.8″, overlay=true)
select_inp = input(defval=”All OHLC”, title=’OHLC Selection’, options=[“All OHLC”,”Only High/Low”,”Only Open/Close”])
pm = input(false, title=”Show Pre-Month OHLC?”)
pw = input(false, title=”Show Pre-Week OHLC?”)
pd = input(false, title=”Show Pre-Day OHLC?”)
p4h = input(false, title=”Show Pre-4-Hour OHLC?”)
p2h = input(false, title=”Show Pre-2-Hour OHLC?”)
p1h = input(true, title=”Show Pre-1-Hour OHLC?”)
p30m = input(false, title=”Show Pre-30-Min OHLC?”)
p15m = input(false, title=”Show Pre-15-Min OHLC?”)
//Monthly
mo = security(tickerid, ‘M’, open[1], lookahead=barmerge.lookahead_on)
mc = security(tickerid, ‘M’, close[1], lookahead=barmerge.lookahead_on)
mh = security(tickerid, ‘M’, high[1], lookahead=barmerge.lookahead_on)
ml = security(tickerid, ‘M’, low[1], lookahead=barmerge.lookahead_on)
//Weekly
wo = security(tickerid, ‘W’, open[1], lookahead=barmerge.lookahead_on)
wc = security(tickerid, ‘W’, close[1], lookahead=barmerge.lookahead_on)
wh = security(tickerid, ‘W’, high[1], lookahead=barmerge.lookahead_on)
wl = security(tickerid, ‘W’, low[1], lookahead=barmerge.lookahead_on)
//Daily
do = security(tickerid, ‘D’, open[1], lookahead=barmerge.lookahead_on)
dc = security(tickerid, ‘D’, close[1], lookahead=barmerge.lookahead_on)
dh = security(tickerid, ‘D’, high[1], lookahead=barmerge.lookahead_on)
dl = security(tickerid, ‘D’, low[1], lookahead=barmerge.lookahead_on)
//4 Hour
fho = security(tickerid, ‘240’, open[1], lookahead=barmerge.lookahead_on)
fhc = security(tickerid, ‘240’, close[1], lookahead=barmerge.lookahead_on)
fhh = security(tickerid, ‘240’, high[1], lookahead=barmerge.lookahead_on)
fhl = security(tickerid, ‘240’, low[1], lookahead=barmerge.lookahead_on)
//2 Hour
tho = security(tickerid, ‘120’, open[1], lookahead=barmerge.lookahead_on)
thc = security(tickerid, ‘120’, close[1], lookahead=barmerge.lookahead_on)
thh = security(tickerid, ‘120’, high[1], lookahead=barmerge.lookahead_on)
thl = security(tickerid, ‘120’, low[1], lookahead=barmerge.lookahead_on)
//1 Hour
oho = security(tickerid, ’60’, open[1], lookahead=barmerge.lookahead_on)
ohc = security(tickerid, ’60’, close[1], lookahead=barmerge.lookahead_on)
ohh = security(tickerid, ’60’, high[1], lookahead=barmerge.lookahead_on)
ohl = security(tickerid, ’60’, low[1], lookahead=barmerge.lookahead_on)
//30 Min
tomo = security(tickerid, ’30’, open[1], lookahead=barmerge.lookahead_on)
tomc = security(tickerid, ’30’, close[1], lookahead=barmerge.lookahead_on)
tomh = security(tickerid, ’30’, high[1], lookahead=barmerge.lookahead_on)
toml = security(tickerid, ’30’, low[1], lookahead=barmerge.lookahead_on)
//15 Min
ofmo = security(tickerid, ’15’, open[1], lookahead=barmerge.lookahead_on)
ofmc = security(tickerid, ’15’, close[1], lookahead=barmerge.lookahead_on)
ofmh = security(tickerid, ’15’, high[1], lookahead=barmerge.lookahead_on)
ofml = security(tickerid, ’15’, low[1], lookahead=barmerge.lookahead_on)
//Plots
select = select_inp == “All OHLC” ? 0 : select_inp == “Only High/Low” ? 1 : 2
//Monthly
plot(pm and mo and (select == 0 or select == 2) ? mo : na, title=”Pre-Month Open”, style=linebr, linewidth=1, color=#DF01D7, transp=0)
plot(pm and mc and (select == 0 or select == 2) ? mc : na, title=”Pre-Month Close”, style=linebr, linewidth=1, color=blue, transp=0)
plot(pm and mh and (select == 0 or select == 1) ? mh : na, title=”Pre-Month High”, style=linebr, linewidth=1, color=black, transp=0)
plot(pm and ml and (select == 0 or select == 1) ? ml : na, title=”Pre-Month Low”, style=linebr, linewidth=1, color=black, transp=0)
//Weekly
plot(pw and wo and (select == 0 or select == 2) ? wo : na, title=”Pre-Week Open”, style=linebr, linewidth=1, color=#DF01D7, transp=0)
plot(pw and wc and (select == 0 or select == 2) ? wc : na, title=”Pre-Week Close”, style=linebr, linewidth=1, color=blue, transp=0)
plot(pw and wh and (select == 0 or select == 1) ? wh : na, title=”Pre-Week High”, style=linebr, linewidth=1, color=black, transp=0)
plot(pw and wl and (select == 0 or select == 1) ? wl : na, title=”Pre-Week Low”, style=linebr, linewidth=1, color=black, transp=0)
//Daily
plot(pd and do and (select == 0 or select == 2) ? do : na, title=”Pre-Day Open”, style=linebr, linewidth=1, color=#DF01D7, transp=0)
plot(pd and dc and (select == 0 or select == 2) ? dc : na, title=”Pre-Day Close”, style=linebr, linewidth=1, color=blue, transp=0)
plot(pd and dh and (select == 0 or select == 1) ? dh : na, title=”Pre-Day High”, style=linebr, linewidth=1, color=black, transp=0)
plot(pd and dl and (select == 0 or select == 1) ? dl : na, title=”Pre-Day Low”, style=linebr, linewidth=1, color=black, transp=0)
//4 Hour
plot(p4h and fho and (select == 0 or select == 2) ? fho : na, title=”Pre-4-Hour Open”, style=linebr, linewidth=1, color=#DF01D7, transp=0)
plot(p4h and fhc and (select == 0 or select == 2) ? fhc : na, title=”Pre-4-Hour Close”, style=linebr, linewidth=1, color=blue, transp=0)
plot(p4h and fhh and (select == 0 or select == 1) ? fhh : na, title=”Pre-4-Hour High”, style=linebr, linewidth=1, color=black, transp=0)
plot(p4h and fhl and (select == 0 or select == 1) ? fhl : na, title=”Pre-4-Hour Low”, style=linebr, linewidth=1, color=black, transp=0)
//2 Hour
plot(p2h and tho and (select == 0 or select == 2) ? tho : na, title=”Pre-2-Hour Open”, style=linebr, linewidth=1, color=#DF01D7, transp=0)
plot(p2h and thc and (select == 0 or select == 2) ? thc : na, title=”Pre-2-Hour Close”, style=linebr, linewidth=1, color=blue, transp=0)
plot(p2h and thh and (select == 0 or select == 1) ? thh : na, title=”Pre-2-Hour High”, style=linebr, linewidth=1, color=black, transp=0)
plot(p2h and thl and (select == 0 or select == 1) ? thl : na, title=”Pre-2-Hour Low”, style=linebr, linewidth=1, color=black, transp=0)
//1 Hour
plot(p1h and oho and (select == 0 or select == 2) ? oho : na, title=”Pre-1-Hour Open”, style=linebr, linewidth=1, color=#DF01D7, transp=0)
plot(p1h and ohc and (select == 0 or select == 2) ? ohc : na, title=”Pre-1-Hour Close”, style=linebr, linewidth=1, color=blue, transp=0)
plot(p1h and ohh and (select == 0 or select == 1) ? ohh : na, title=”Pre-1-Hour High”, style=linebr, linewidth=1, color=black, transp=0)
plot(p1h and ohl and (select == 0 or select == 1) ? ohl : na, title=”Pre-1-Hour Low”, style=linebr, linewidth=1, color=black, transp=0)
//30 Min
plot(p30m and tomo and (select == 0 or select == 2) ? tomo : na, title=”Pre-30-Min Open”, style=linebr, linewidth=1, color=#DF01D7, transp=0)
plot(p30m and tomc and (select == 0 or select == 2) ? tomc : na, title=”Pre-30-Min Close”, style=linebr, linewidth=1, color=blue, transp=0)
plot(p30m and tomh and (select == 0 or select == 1) ? tomh : na, title=”Pre-30-Min High”, style=linebr, linewidth=1, color=black, transp=0)
plot(p30m and toml and (select == 0 or select == 1) ? toml : na, title=”Pre-30-Min Low”, style=linebr, linewidth=1, color=black, transp=0)
//15 Min
plot(p15m and ofmo and (select == 0 or select == 2) ? ofmo : na, title=”Pre-15-Min Open”, style=linebr, linewidth=1, color=#DF01D7, transp=0)
plot(p15m and ofmo and (select == 0 or select == 2) ? ofmc : na, title=”Pre-15-Min Close”, style=linebr, linewidth=1, color=blue, transp=0)
plot(p15m and ofmo and (select == 0 or select == 1) ? ofmh : na, title=”Pre-15-Min High”, style=linebr, linewidth=1, color=black, transp=0)
plot(p15m and ofmo and (select == 0 or select == 1) ? ofml : na, title=”Pre-15-Min Low”, style=linebr, linewidth=1, color=black, transp=0)
Thanks and best regards!