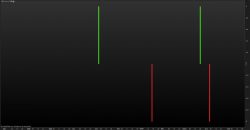
Pour un signal cela semble en effet assez simple.
Et pour un code comme celui-ci, est-il possible de créer un histogramme (+1 / -1 vert / rouge) selon que la ligne de tendance est croissante ou décroissante ?
Merci d’avance …
if (CCI[50](typicalPrice)>=0) then
magic=Low[0]-AverageTrueRange[5](close)
endif
if (CCI[50](typicalPrice)<0) then
magic=High[0]+AverageTrueRange[5](close)
endif
if (CCI[50](typicalPrice)>=0 and magic<magic[1]) then
magic=magic[1]
endif
if (CCI[50](typicalPrice)<0 and magic>magic[1]) then
magic=magic[1]
endif
return magic

