rama
ramaParticipant
Senior
Can you one help me with code for double bottom or double top?
I want the code on any time frame 5 or 20 min or 60 min.
Hi rama
Hope you get a response. You may want to see my Thread asking for Double Top / Bottom.
https://www.prorealcode.com/topic/double-top-bottom/
It’s easy to see the pattern on a Chart, but not easy to code due to variation in number of bars between cycles.
Cheers
GraHal
Hi rama,
maybe this approach can be of help:
If high crosses over highest[x](high) and waitfortop=0 then  //x=20 for example
waitfortop=1
Currenthigh=high
Endif

If close < currenthigh and waitfortop=1 then
Top=1
Endif

If close >= Currenthigh and top=1 then
Waitforsecondtop=1
Currenthigh =high
Endif

If close < currenthigh and Waitforsecondtop=1 then
Top=2
Endif

If top=2 then
Event=1
Endif

If top [1]=2 then
Top=0
Waitfortop=0
Waitforsecondtop=0
Event=0
Endif

Return event
Of course this can be cleaned up a lot. But I hope you get the idea.
 Maz
MazParticipant
Veteran
Yep, the challenge is to write a pattern detector (ie double top/bottom) detector without any hard coded constants (such as x, above) – so as to recognize the pattern regardless of its time duration or volatility. Noise is also an issue.
When is a possible double top no longer a double top? Define that without constants….
When is a possible double top no longer a double top?
When price does not go below the low of the trough between the possible double tops?
ramaParticipant
Senior
As I understand coding for perfect double bottom or double top does not exist , also practically perfect W or M may not happen in reality.
Let me rephrase my requirement.
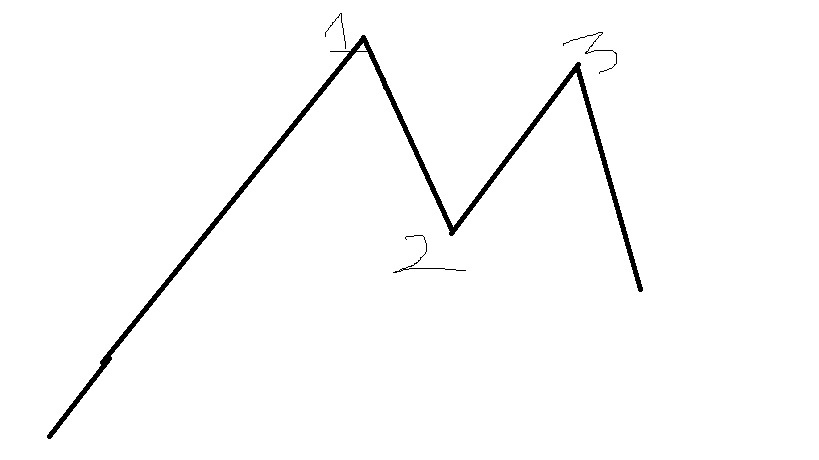
I have attached the pattern.
What I am looking is
I will have two variables
V1= Price 1 – price 2
V2 = absoulute value of price 1- price 3( this absolute because some price 1 may high some time price 3 may be high)
my idea is to trade break outs below price 2
MazParticipant
Veteran
Professionally I work with neural networks which feed into trading systems – they look at these patterns like a photo. That’s the best way to detect them. Alas, PRT… It would be great if PRT could incorporate functions, arrays and better maths in their language – that way some simple pattern training can be written for it. I’m so close to just starting an open source trading language with pattern recognition functions – have to stop myself every day 😀 (because it’s a large project and because time is precious!)
Back on topic (rant over), I’ll post some code here when I get the chance. Thanks @rama for the input. Will be useful for me too as I do a fair bit of modelling in PRT
ramaParticipant
Senior
Screen detectors are available for this pattern standard charting packages such as IG or Autochartist.
if we select the time frame(15 min) and all currencies, software will display all currencies which is currently matching this double top or double bottom pattern.
My idea to automate my trading instead of screening and placing orders.
Thats what I’ve been saying for many.. well at least 8 month. Pattern recognision!!
MAZ you can do it, I’m counting on you!
😀 Kasper
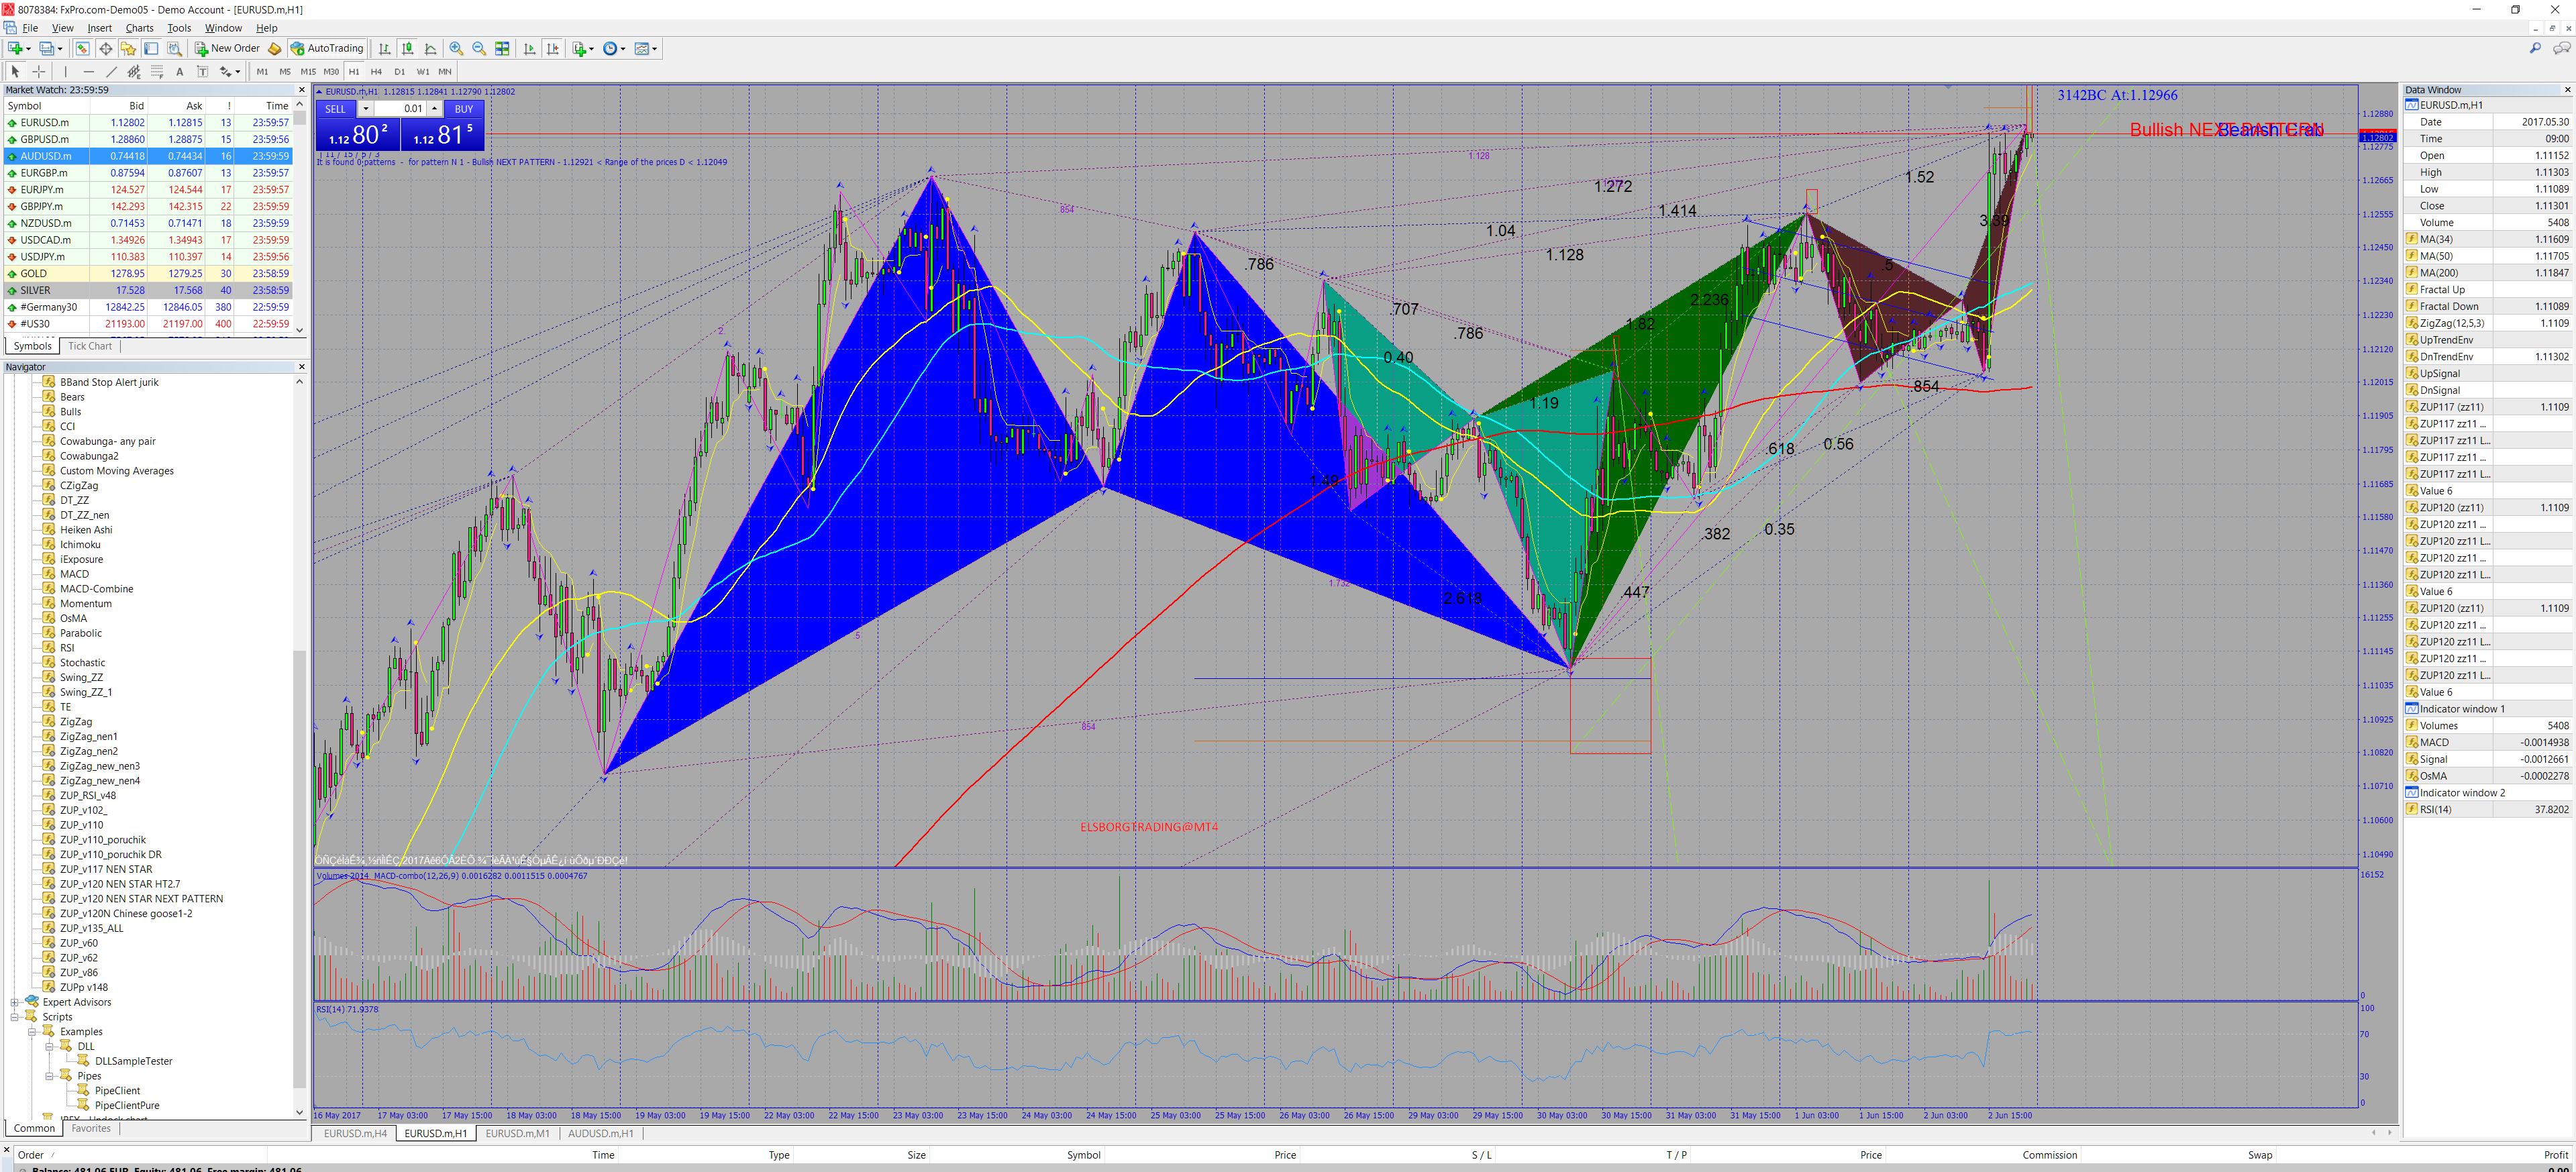
Anyway what about Bat, Crab, Cypher patterns, etc.. they all relay on fib. retracements- That should somehow be possible- what your thoughts?
MazParticipant
Veteran
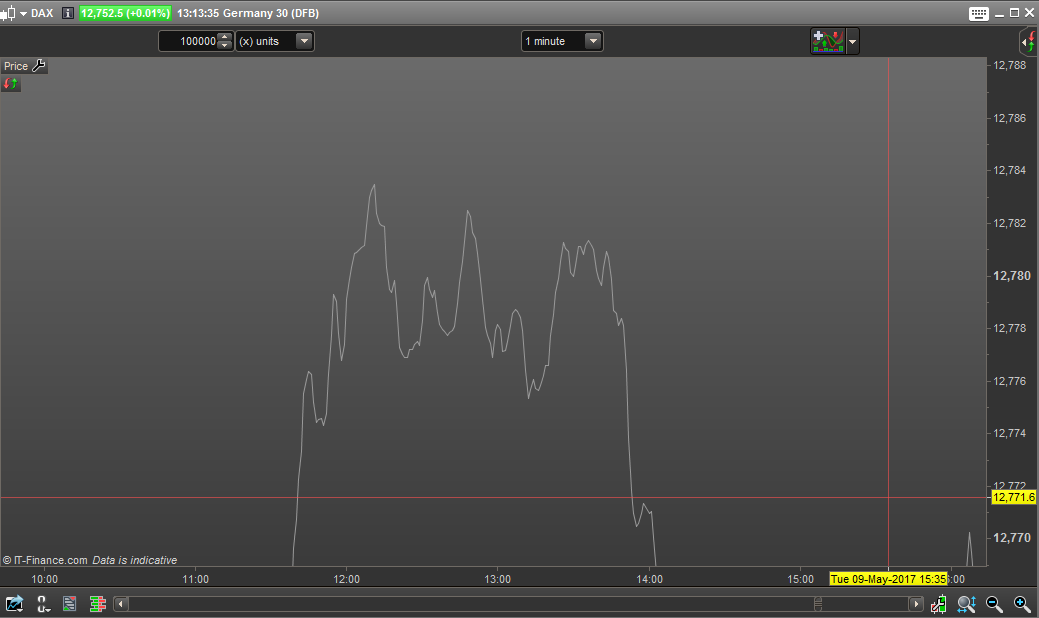
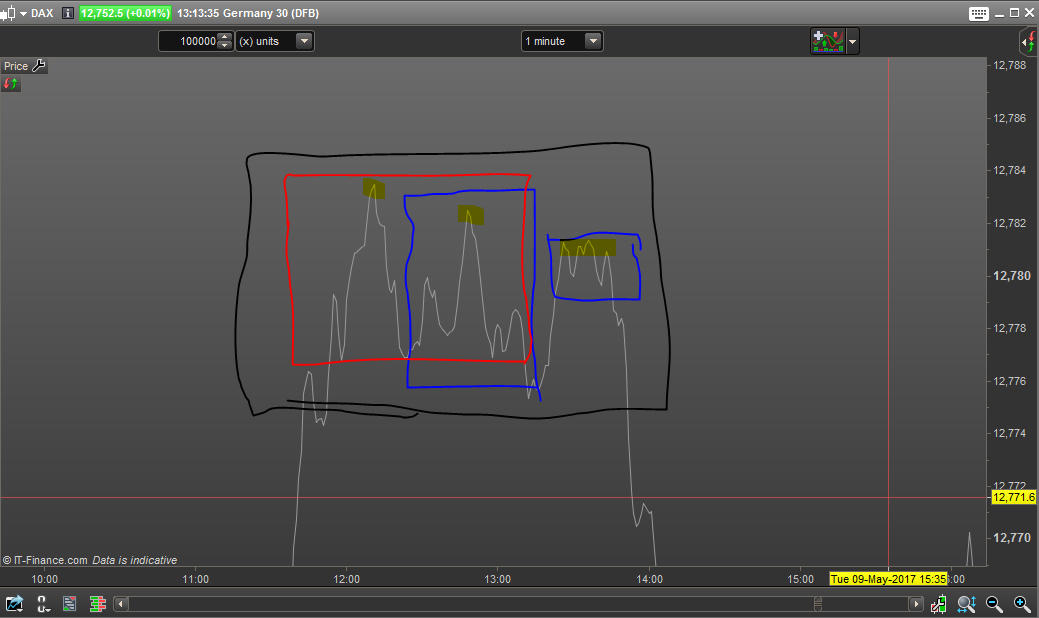
Is it a bird? Is it a plane? Is it a duck? Is it Buffet on a jet ski? Maybe it’s all of them? Oh, it’s a complex-chaotic, highly manipulated financial market!
What am I talking about?
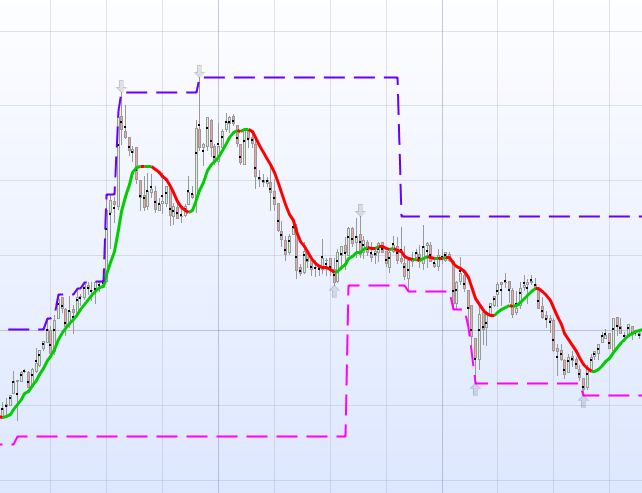
Check out the screen shots. What do you see? A double top? A triple top? A head and shoulders? Two head and shoulders?
It’s a triple top whereby the second top is a failed head-and-shoulders and the third top is a successful head-and-shoulders.
Where do we start?
if …. then…. ? Or just take a photo and have a bunch of neurons make the decision? 😀
This was my point about noise. Just something to think about.
Best,
M
The price move can be transfered into all patterns but how many visually perceivable patterns can the code not recognize correct plus the fake signals. In the end we still receive A pattern that can be tested and improved upon. Maybe the way to the big pattern on the higher timeframes is by looking at all the little ones first.
So, coding pattern recognition indicators is the starting point for further research.
@Maz, ohh well.. at least someone was able to do it.. but if you can’t do it, you know… 😉 Advancepattern
Okay, the ironic, and poking you pride is over. Being here for a long time, you can just tell when someone is professional, and you are. So I still think you can do it 🙂
I tried to put this on MT4 platform and it works. I still need to verify if is accurate and how many pattern it recognize. At the start of the post, there is some of the indicators in .Mq4 format and is easy compiled with the compiler described for MT4. perhaps you know to decode it and convert to PRT.
Though I left the PRT platform I still thought I’d let you know.
Cheers Kasper
 Leo
LeoParticipant
Veteran
Hi all,
What if the approach for looking to double top/bottoms is first to detect maximum and minimum locals ?
I have a code that can be use for this goal.
Here is the theory:
- We take a moving average
- We make a second moving average
- When one crosses the other then, there is a max/min local in that area
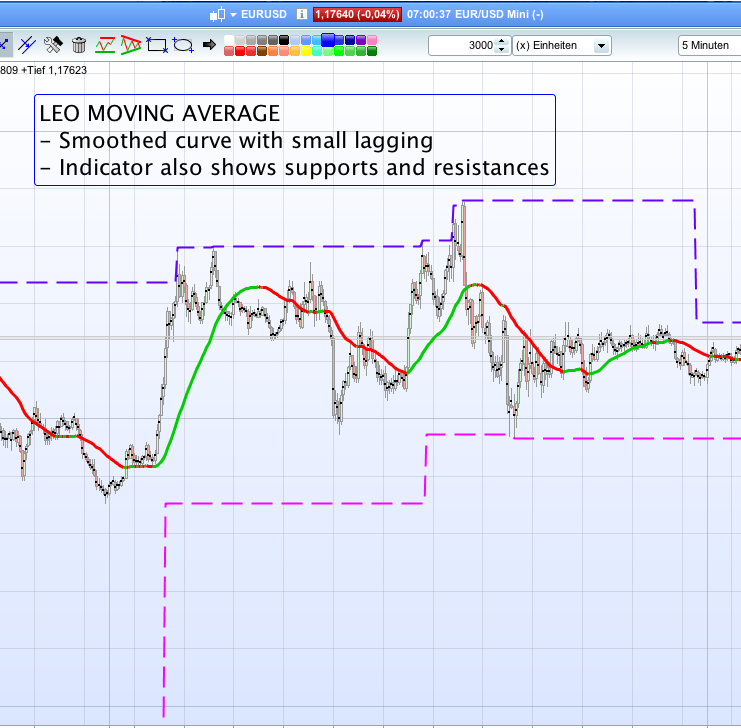
Here I show my indicator (pending of posting approval in the library) and help to locate max/min.
I will continue to developing this idea for detect doubles top/ bottoms
//LEO MOVING AVERAGE

//Formula: LMA=WMA+(WMA-SMA)
LMA=2*weightedaverage[period](close)-average[period](close)


//supports and resistances
once support=low
once resistance=high

smoothLMA=weightedaverage[period](LMA)

IF LMA crosses over smoothLMA THEN
support=lowest[period](low)
ENDIF

IF LMA crosses under smoothLMA THEN
resistance=highest[period](high)
ENDIF

support=min(low,support)
resistance=max(high,resistance)


RETURN LMA AS "LMA", support as "support", resistance as "resistance"
LeoParticipant
Veteran
Hi all,
I found a way to detect and locate minimums and maximums local… I think this idea have a lot of potencial
Here is my code
//LEO MOVING AVERAGE

//Formula: LMA=WMA+(WMA-SMA)
LMA=2*weightedaverage[period](close)-average[period](close)


//supports and resistances
once support=low
once resistance=high

smoothLMA=weightedaverage[period](LMA)


// ---> Storage of minimums and maximums
IF BARINDEX>1 THEN
IF low < lowest[period](low[1]) THEN
mintemp=low //minimum temporal
posmintemp=BARINDEX //postition of minimum temporal
ENDIF
IF high > highest[period](high[1]) then
maxtemp=high //maximum temporal
posmaxtemp=BARINDEX //position maximum temporal
ENDIF
ENDIF

// --> Detecting and locating a local minimum
IF LMA crosses over smoothLMA THEN
LEVMIN=mintemp
POSLEVMIN=posmintemp
support=LEVMIN
DRAWARROWUP(POSLEVMIN,LEVMIN) coloured(0,0,0,30)
ENDIF

// --> Detecting and locating a local maximum
IF LMA crosses under smoothLMA THEN
LEVMAX=maxtemp
POSLEVMAX=posmaxtemp
resistance=LEVMAX
DRAWARROWDOWN(POSLEVMAX,LEVMAX) coloured(0,0,0,30)
ENDIF

support=min(low,support)
resistance=max(high,resistance)


RETURN LMA AS "LMA", support as "support", resistance as "resistance"
Hi Leo, this is a good idea, so for now to validate a double top or double bottom we have to fetch through the LEVMIN and LEVMAX previous values if 2 consecutive ones are within the same range, if I follow you idea? This range could be set as a percentage of their values, don’t you think?