Elliott Waves Indicator – indicator conversion code mq4 to prorealtime
Forums › ProRealTime English forum › ProBuilder support › Elliott Waves Indicator – indicator conversion code mq4 to prorealtime
- This topic has 7 replies, 6 voices, and was last updated 4 years ago by
GraHal.
-
-
05/14/2018 at 6:16 AM #70321
Good day,
Please can you help with this indicator conversion. It came with two files to convert.
Reference from site:
“Author:
Vladimir Hlystov
The indicator doesn’t draw the Elliott waves, but it helps you to define them.
Lets consider how does it works:
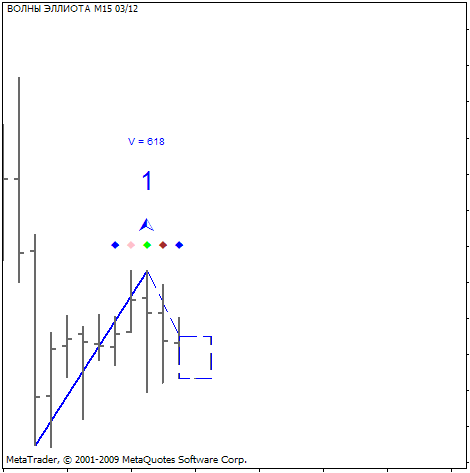
1. The WAVE. The first, you should draw any trend line using Fractals and define its name it in the following form : “1<space>*****”, for exampe: “1 wave“. After the first tick, or if you don’t want to wait for it, update it using the right mouse button you will get the picture like this:
The dotted line with rectange shows the estimated price movement, and if the wave has been defined correctly, the price will came into the estimated rectange. V is the average volume in the 1st wave.
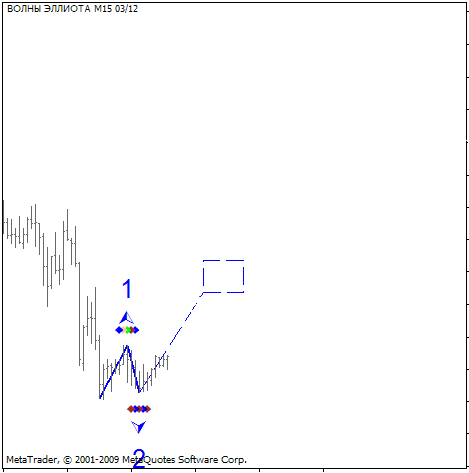
After that, we are waiting for the lower fractal and rename the dotted line to “2 wave” (note that the number and space after it are important). Now moving the end of that line on the next formed fractal (lower) and we will get the estimated price movement in the 3rd wave:
(if you have moved the line to the bar without fractal, the indicator will inform you about it and will try to move the line by its own vision. If the line hasn’t been moved by the indicator, you should move it on the fractal manually)
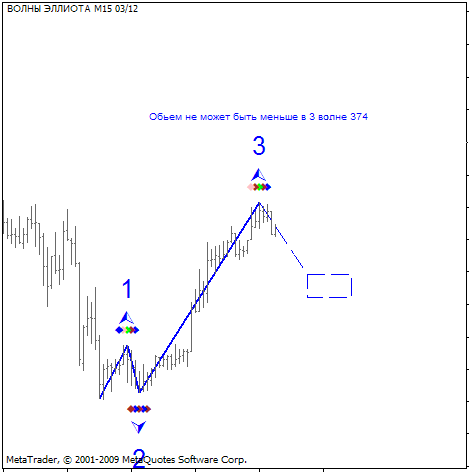
After the price will reach rectangle (in our case we have the movement, the price moved upper than the estimated target), you should rename the dotted line to “3 wave” and remove it to the upper fractal. The result you will see looks as follows:
The indicator informs us, that the average volume in the 3rd wave is always larger, than in the 1st wave. So it’s possible that our wave definition was wrong.
But anyway, we have reached the target estimated and we can continue.
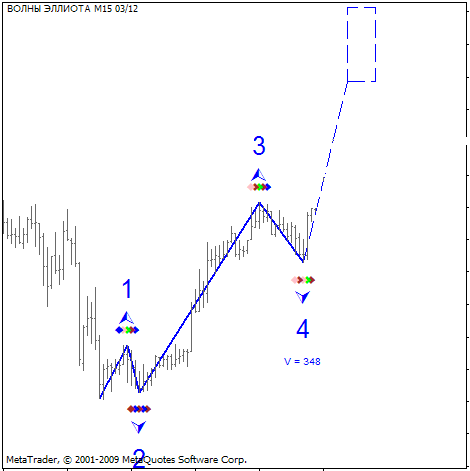
After the price will reach the estimated target and after the next fractal formation we rename the dotted line to “4 wave” and remove its end on the fractal:
Further, we should wait for the upper fractal in the target estimated and draw the “a b c” retracement. Read the book “Trade Chaos” by Bill Williams for the details.
Recommendations:
The indicator “Fractals.mq4″ (it also attached here) helps to draw of the first line. Don’t place orders right after the fractal, its better to wait for the price movement in the directon estimated. Of course in such case the profit will be less, but the risk will be the same. I recommend to place Stop Loss as adviced by Bill Williams.”
Regards,
Segie
05/14/2018 at 11:58 AM #70345Thanks for all the explanation about this indicator.
This “Elliott Waves” indicator uses multi dimensional variables arrays to store dynamically price values. It is necessary for evaluating each points of the waves between other ones, but unfortunately, this is not possible with the current version of the ProBuilder language.
03/06/2019 at 3:33 PM #9299603/06/2019 at 4:03 PM #92997Elliot Waves tool is part of the upcoming version 11 of the platform.
Fibonacci Time tool is already featured in the actual version (v10.3).
3 users thanked author for this post.
02/14/2020 at 1:33 PM #119631hello nicolas, you are sure of these 2 .mq4 files you can convert them into .itf files for PRT, in version V11 probuilder allows it may be today in jan 2020, a dev request to PRT coming from you would have more weight. .. no ??
02/15/2020 at 7:18 PM #119710thebigdeal – Your post has been tidied up and the previous half post deleted – do not post your question in the PRT Code box in future posts. Please try to be more careful when posting.
02/19/2020 at 8:27 AM #119919Fibonacci Time tool is already featured in the actual version (v10.3).
Seems weird that the Time Tool always displays the Time of the 2nd point on all the other points … see attached 02:55 is displayed at all points??
As a Fib Time Zone Tool I would expect the times to be calculated / projected / incremented forward so that I could think … ah I best check my Chart around 09:55 this morning as the Fib Time Zone Tool predicts there may be a change of trend direction at around about 09:55 + or -.
Are we sure the Fib Time Zone Tool is working correctly re the time imprint text??
02/19/2020 at 1:38 PM #119941I reckon … the date / time stamp of the 2nd point is imprinted on all the subsequent points to distinguish between major, minor, sub-minor (or whatever the correct term!? 🙂 Elliott Waves on the same chart.
If the time stamp was incremented for each point (as I suggested in my previous post) then the Timezone lines would be chaotic and unusable.
But my suggestion (in previous post) would be very useful as a user option / check box.
I only ever use one set of Elliott Waves at a time anyway.
-
AuthorPosts
Find exclusive trading pro-tools on 


