H/L AVG Opening 5min
Forums › ProRealTime English forum › ProBuilder support › H/L AVG Opening 5min
- This topic has 9 replies, 3 voices, and was last updated 6 years ago by
 Kam Mahey.
-
-
06/27/2018 at 11:06 AM #74518
Hello all,
I’m very new to ProRealtime and require some help while still learning how to code.
I would like to automate a horizontal line h/l avg (mid) of the opening 5min candlestick created on a 5min candlestick chart.
Would need to also see historic opening 5min candlestick h/l avg horizontal lines also on the chart.
Any help would be appreciated.
Many Thanks
06/27/2018 at 11:13 AM #74521(mid) of the opening 5min candlestick
You mean the market open? Is it the first bar of the day or a candlestick at a precise hour? (CFD is different from Future opening hour).
06/27/2018 at 5:45 PM #7455506/28/2018 at 8:59 AM #74595The fastest and easy way to do that is:
1234567timeopen = 083500if time=timeopen thendrawhline((high+low)/2)endifreturnYou can change yourself the “timeopen” variable to adjust the market open hour if you want to.
Lines can only be plain one (no dotted one sorry..).
1 user thanked author for this post.
06/28/2018 at 12:10 PM #74608Hi Nicolas,
How do i add this to the main price chart?
Thank you so much for this, i am a total newbie to this platform and have been with Sierra Charts for years so big learning curve for me.
Need to spend a lot of hours learning this platform.
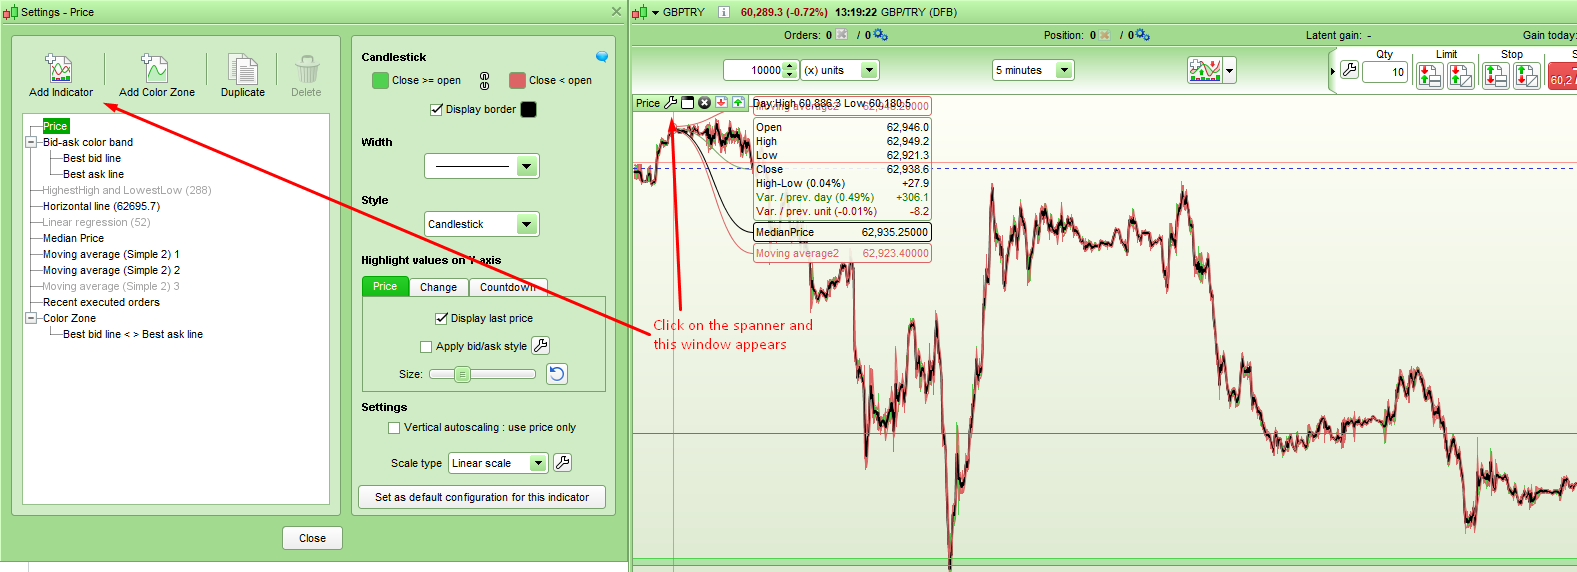
06/28/2018 at 12:19 PM #74609If you have already created it as an indicator then just click on the spanner in the corner of the price chart and a window will come up where you have the option to add indicators to the chart.
1 user thanked author for this post.
06/28/2018 at 1:12 PM #74613I have added the indicator and named it ‘5min h/l avg’.
i right-clicked on chart and selected ‘settings price’ added indicator ‘5min h/l avg’
Nothing shows up on chart and ‘5min h/l avg’ indicator is a light grey colour in the ‘Settings – Price’ where other indicators, i.e VWAP is black.
06/28/2018 at 1:13 PM #7461406/28/2018 at 1:21 PM #7461507/07/2018 at 10:30 PM #75554Hi all again,
Need some more help 🙁 please.
I would like the same as above but on a daily chart as well, so a horizontal line created on the mid of each daily candle.
My main goal would be just to create the hline on the mid of a daily candle on the top 50 to 100 candles which have the highest amount of volume over a given amount of units?
Thanks
-
AuthorPosts
Find exclusive trading pro-tools on ![]()