Hello everyone,
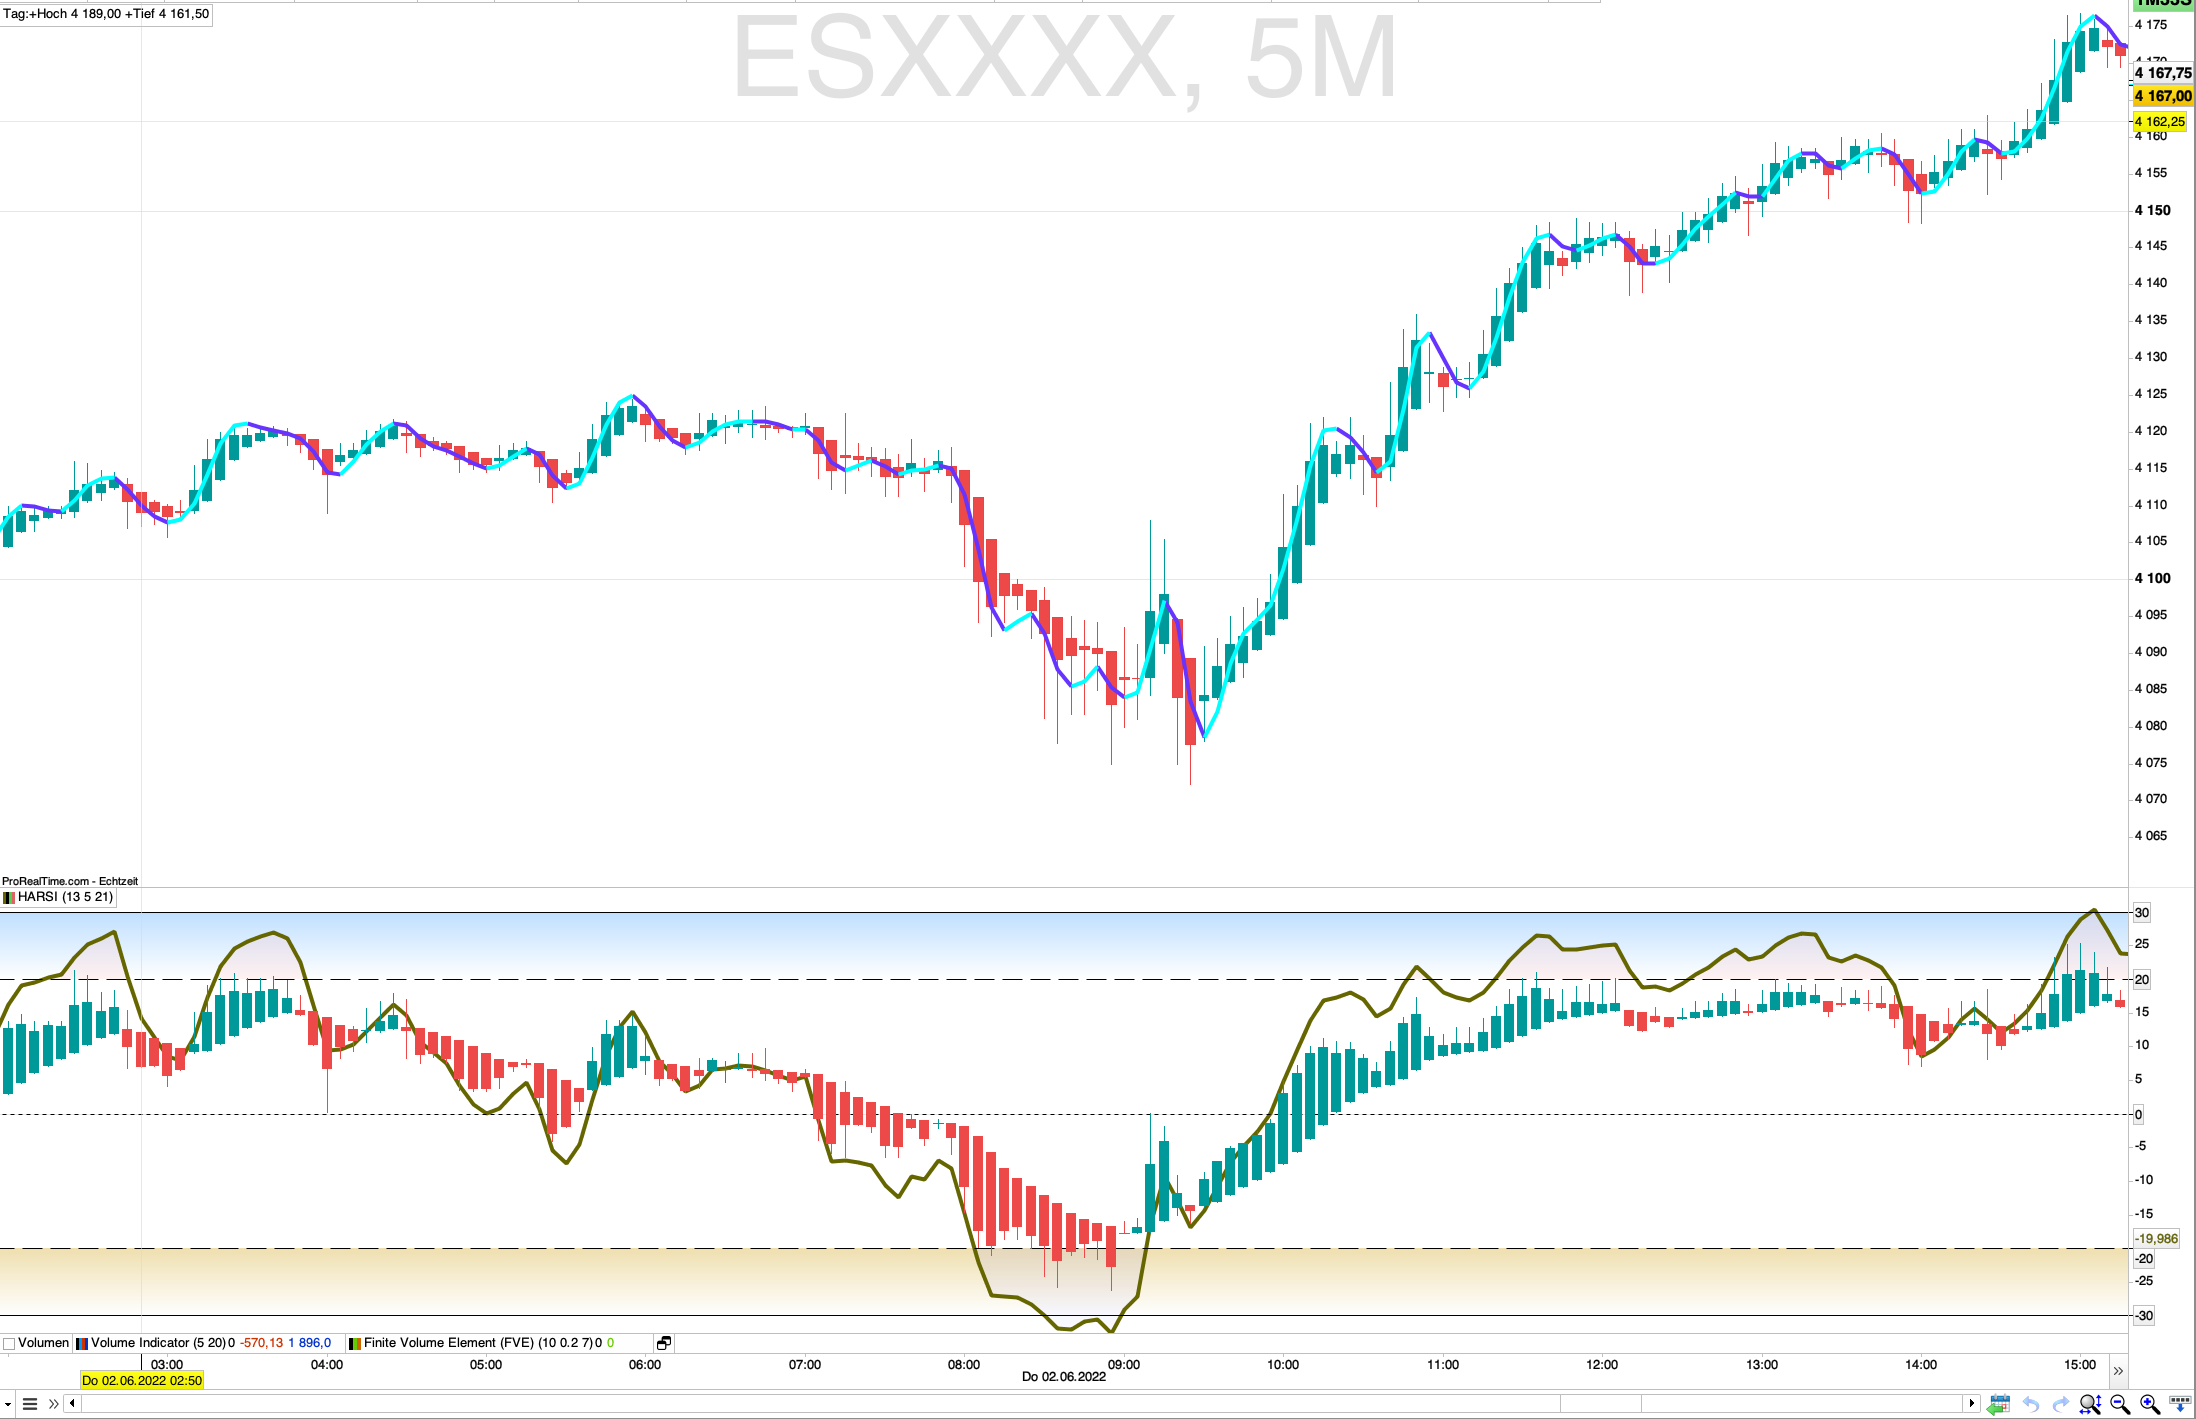
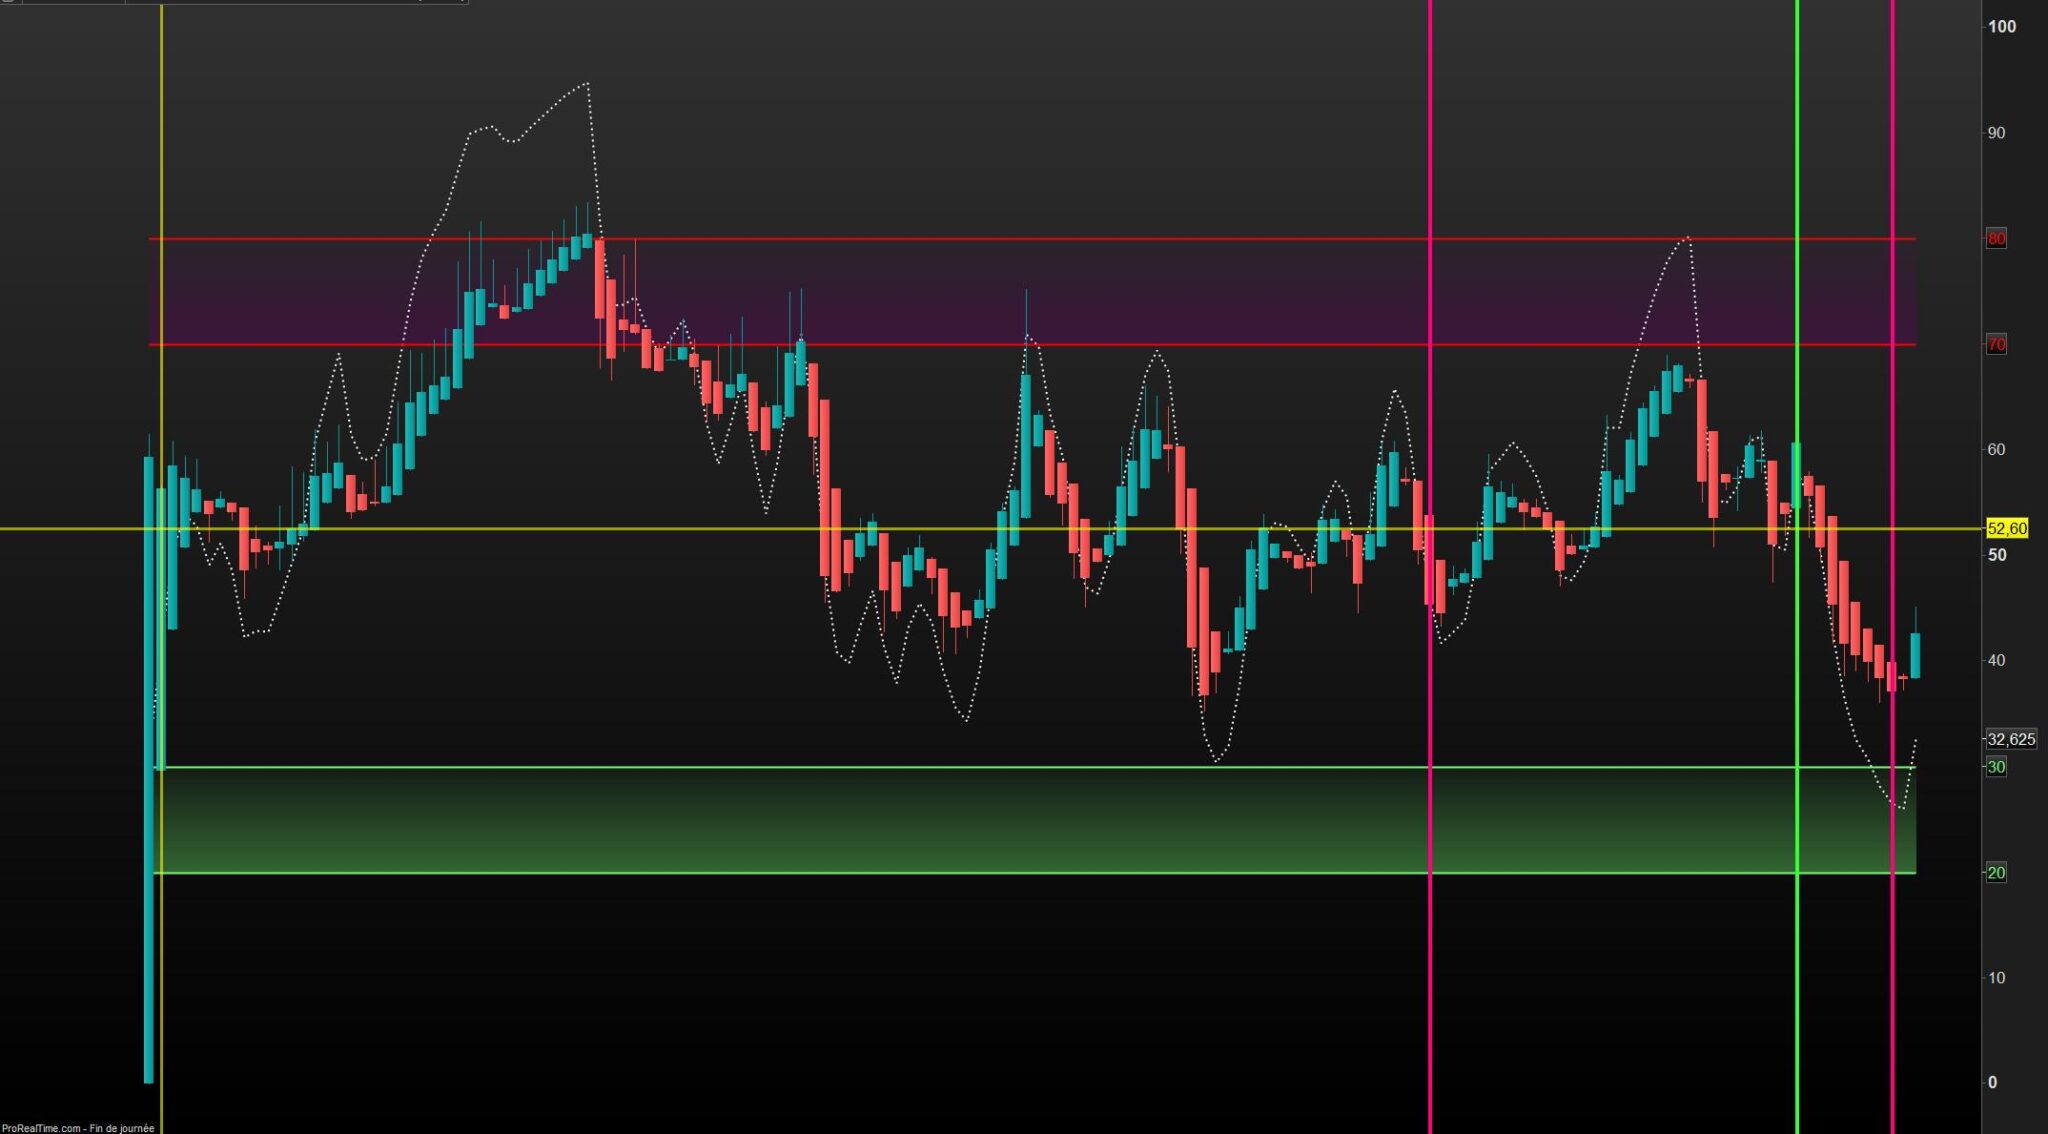
I’d like to use this HARSI Indicator (from JayRogers) from tradingview on Prorealtime as I find it very useful. Does someone know how to convert the code from tradingview to prorealtime? Or by any chance is there the exact same indicator already existing on the forum (couldn’t seem to find it though).
Thanks
Here is the Tradingview code :
// This source code is free to use, copy, and alter in any way you choose.
// ...but credit is always nice :)

//@version=4
//@author=JayRogers

study( "Heikin Ashi RSI Oscillator", "HARSI •", false, format.price, 2 )

////////////////////////////////////////////////////////////////////////////////
// //
// ====== ABOUT THIS INDICATOR //
// //
// - RSI based Heikin Ashi candle oscillator //
// //
// ====== ARTICLES and FURTHER READING //
// //
// - https://www.investopedia.com/terms/h/heikinashi.asp //
// //
// "Heikin-Ashi is a candlestick pattern technique that aims to reduce //
// some of the market noise, creating a chart that highlights trend //
// direction better than typical candlestick charts" //
// //
// ====== REASON FOR STUDY //
// //
// - Mostly experimental. I wanted to see if I could translate RSI into a //
// Heikin Ashi function and retain it's oscillating nature. That goal //
// was met more easily than I anticipated with quite delightful results. //
// //
// ====== DISCLAIMER //
// //
// Any trade decisions you make are entirely your own responsibility. //
// I've made an effort to squash all the bugs, but you never know! //
// //
////////////////////////////////////////////////////////////////////////////////

////////////////////////////////////////////////////////////////////////////////
// //
// ====== TOOLTIPS ====== //
// //
////////////////////////////////////////////////////////////////////////////////

string TT_HARSI = "Period for the RSI calculations used to generate the" +
"candles. This seperate from the RSI plot/histogram length."

string TT_PBIAS = "Smoothing feature for the OPEN of the HARSI candles." +
"\n\nIncreases bias toward the prior open value which can" +
" help provide better visualisation of trend strength." +
"\n\n** By changing the Open values, High and Low can also" +
" be distorted - however Close will remain unchanged."

string TT_SMRSI = "This option smoothes the RSI in a manner similar to HA" +
" open, but uses the realtime rsi rather than the prior" +
" close value."

string TT_STOCH = "Uses the RSI generated by the above settings, and as such" +
" will be affected by the smoothing option."

string TT_STFIT = "Adjusts the vertical scaling of the stochastic, can help" +
" to prevent distortion of other data in the channel." +
"\n\nHas no impact cross conditions."

////////////////////////////////////////////////////////////////////////////////
// //
// ====== INPUTS ====== //
// //
////////////////////////////////////////////////////////////////////////////////

// -- Candle config

string GROUP_CAND = "Config » HARSI Candles"
i_lenHARSI = input( 14, "Length", input.integer, group = GROUP_CAND,
minval = 1, tooltip = TT_HARSI )
i_smoothing = input( 1, "Open Smoothing", input.integer, group = GROUP_CAND,
minval = 1, maxval = 100, tooltip = TT_PBIAS )
string INLINE_COL = "Colour Pallette"
i_colUp = input( color.teal, "Colour Pallette  ", input.color, group = GROUP_CAND, inline = INLINE_COL )
i_colDown = input( color.red, " ", input.color, group = GROUP_CAND, inline = INLINE_COL )
i_colWick = input( color.gray, " ", input.color, group = GROUP_CAND, inline = INLINE_COL )

// -- RSI plot config

string GROUP_PLOT = "Config » RSI Plot"
i_source = input( ohlc4, "Source", input.source, group = GROUP_PLOT )
i_lenRSI = input( 7, "Length", input.integer, group = GROUP_PLOT,
minval = 1 )
i_mode = input( true, "Smoothed Mode RSI?", input.bool, group = GROUP_PLOT,
tooltip = TT_SMRSI )
i_showPlot = input( true, "Show RSI Plot?", input.bool, group = GROUP_PLOT )
i_showHist = input( true, "Show RSI Histogram?", input.bool, group = GROUP_PLOT )

// -- Stochastic RSI plots config

string GROUP_STOCH = "Config » Stochastic RSI Plot"
string INLINE_STDS = "Stoch Draw States"
i_showStoch = input( false, "Show Stochastic? ", input.bool, group = GROUP_STOCH, inline = INLINE_STDS,
tooltip = TT_STOCH )
i_ribbon = input( true, "Ribbon?", input.bool, group = GROUP_STOCH, inline = INLINE_STDS )
i_smoothK = input( 3, "Smoothing K", input.integer, group = GROUP_STOCH,
minval = 1 )
i_smoothD = input( 3, "Smoothing D", input.integer, group = GROUP_STOCH,
minval = 1 )
i_stochLen = input( 14, "Stochastic Length", input.integer, group = GROUP_STOCH,
minval = 1 )
i_stochFit = input( 80, "Stoch Scaling %", input.integer, group = GROUP_STOCH,
minval = 1, maxval = 100, tooltip = TT_STFIT )

// -- Channel OB/OS config

string GROUP_CHAN = "Config » OB/OS Boundaries"
i_upper = input( 20, "OB", input.integer, group = GROUP_CHAN, inline = "OB",
minval = 1, maxval = 50 )
i_upperx = input( 30, "OB Extreme", input.integer, group = GROUP_CHAN, inline = "OB",
minval = 1, maxval = 50 )

i_lower = input( -20, "OS", input.integer, group = GROUP_CHAN, inline = "OS",
minval = -50, maxval = -1 )
i_lowerx = input( -30, "OS Extreme", input.integer, group = GROUP_CHAN, inline = "OS",
minval = -50, maxval = -1 )

////////////////////////////////////////////////////////////////////////////////
// //
// ====== FUNCTIONS ====== //
// //
////////////////////////////////////////////////////////////////////////////////

// zero median rsi helper function, just subtracts 50.
f_zrsi( _source, _length ) => rsi( _source, _length ) - 50

// zero median stoch helper function, subtracts 50 and includes % scaling
f_zstoch( _source, _length, _smooth, _scale ) =>
float _zstoch = stoch( _source, _source, _source, _length) - 50
float _smoothed = sma( _zstoch, _smooth )
float _scaled = ( _smoothed / 100 ) * _scale

// mode selectable rsi function for standard, or smoothed output
f_rsi( _source, _length, _mode ) =>

// get base rsi
float _zrsi = f_zrsi( _source, _length )

// smoothing in a manner similar to HA open, but rather using the realtime
// rsi in place of the prior close value.
var float _smoothed = na
_smoothed := na( _smoothed[1] ) ? _zrsi : ( _smoothed[1] + _zrsi ) / 2

// return the requested mode
_mode ? _smoothed : _zrsi

// RSI Heikin-Ashi generation function
f_rsiHeikinAshi( _length ) =>

// get close rsi
float _closeRSI = f_zrsi( close, _length )

// emulate "open" simply by taking the previous close rsi value
float _openRSI = nz( _closeRSI[1], _closeRSI )

// the high and low are tricky, because unlike "high" and "low" by
// themselves, the RSI results can overlap each other. So first we just go
// ahead and get the raw results for high and low, and then..
float _highRSI_raw = f_zrsi( high, _length )
float _lowRSI_raw = f_zrsi( low, _length )
// ..make sure we use the highest for high, and lowest for low
float _highRSI = max( _highRSI_raw, _lowRSI_raw )
float _lowRSI = min( _highRSI_raw, _lowRSI_raw )

// ha calculation for close
float _close = ( _openRSI + _highRSI + _lowRSI + _closeRSI ) / 4

// ha calculation for open, standard, and smoothed/lagged
var float _open = na
_open := na( _open[ i_smoothing ] ) ? ( _openRSI + _closeRSI ) / 2 :
( ( _open[1] * i_smoothing ) + _close[1] ) / ( i_smoothing + 1 )

// ha high and low min-max selections
float _high = max( _highRSI, max( _open, _close ) )
float _low = min( _lowRSI, min( _open, _close ) )

// return the OHLC values
[ _open, _high, _low, _close ]

////////////////////////////////////////////////////////////////////////////////
// //
// ====== SERIES, LINES and LABELS ====== //
// //
////////////////////////////////////////////////////////////////////////////////

// standard, or ha smoothed rsi for the line plot and/or histogram
float RSI = f_rsi( i_source, i_lenRSI, i_mode )

// stoch stuff
float StochK = f_zstoch( RSI, i_stochLen, i_smoothK, i_stochFit )
float StochD = sma( StochK, i_smoothD )

// get OHLC values to use in the plotcandle()
[ O, H, L, C ] = f_rsiHeikinAshi( i_lenHARSI )

// candle body colouring
color bodyColour = C > O ? i_colUp : i_colDown
color wickColour = i_colWick

// shadow, invisible
color colShadow = color.rgb( 0, 0, 0, 20 )
color colNone = color.rgb( 0, 0, 0, 100 )

// rsi color
color colRSI = color.rgb( 250, 200, 50, 0 )

// stoch ribbon fill
color colStochK = color.new( #0094FF, 0 )
color colStochD = color.new( #FF6A00, 0 )
color colStochFill = StochK >= StochD ? color.new( colStochK, 50 ) : color.new( colStochD, 50 )

////////////////////////////////////////////////////////////////////////////////
// //
// ====== DRAWING and PLOTTING ====== //
// //
////////////////////////////////////////////////////////////////////////////////

// zero median RSI channel hlines
upperx = hline( i_upperx, "OB Extreme", color.new( color.silver, 60 ) )
upper = hline( i_upper, "OB", color.new( color.silver, 80 ) )
median = hline( 0, "Median", color.orange, hline.style_dotted )
lower = hline( i_lower, "OS", color.new( color.silver, 80 ) )
lowerx = hline( i_lowerx, "OS Extreme", color.new( color.silver, 60 ) )

// channel fill
fill( upper, upperx, color.new( color.red, 90 ), title = "Background Fill OB" )
fill( upper, lower, color.new( color.blue, 90 ), title = "Background Channel" )
fill( lower, lowerx, color.new( color.green, 90 ), title = "Background Fill OS" )

// histogram first, so it is on the bottom of the plot/candle draw stack
plot( i_showHist ? RSI : na, "RSI Histogram", color.new( color.silver, 80 ), 1, plot.style_histogram )

// make our HA rsi candles
plotcandle( O, H, L, C, "HARSI", bodyColour, wickColour, bordercolor = bodyColour )

// RSI overlay plot
plot( i_showPlot ? RSI : na, "RSI Shadow", colShadow, 3 )
plot_rsi = plot( i_showPlot ? RSI : na, "RSI Overlay", colRSI, 1 )

// Stochastic RSI plots and fill
plot( i_showStoch ? StochK : na, "Stoch K Shadow", not i_ribbon ? colShadow : colNone, 3 )
plot( i_showStoch ? StochD : na, "Stoch D Shadow", not i_ribbon ? colShadow : colNone, 3 )
plot_stochK = plot( i_showStoch ? StochK : na, "Stoch K", not i_ribbon ? colStochK : colNone, 1 )
plot_stochD = plot( i_showStoch ? StochD : na, "Stoch D", not i_ribbon ? colStochD : colNone, 1 )
fill( plot_stochK, plot_stochD, i_ribbon ? colStochFill : na )

// -- PEANUT