Hi everyone,
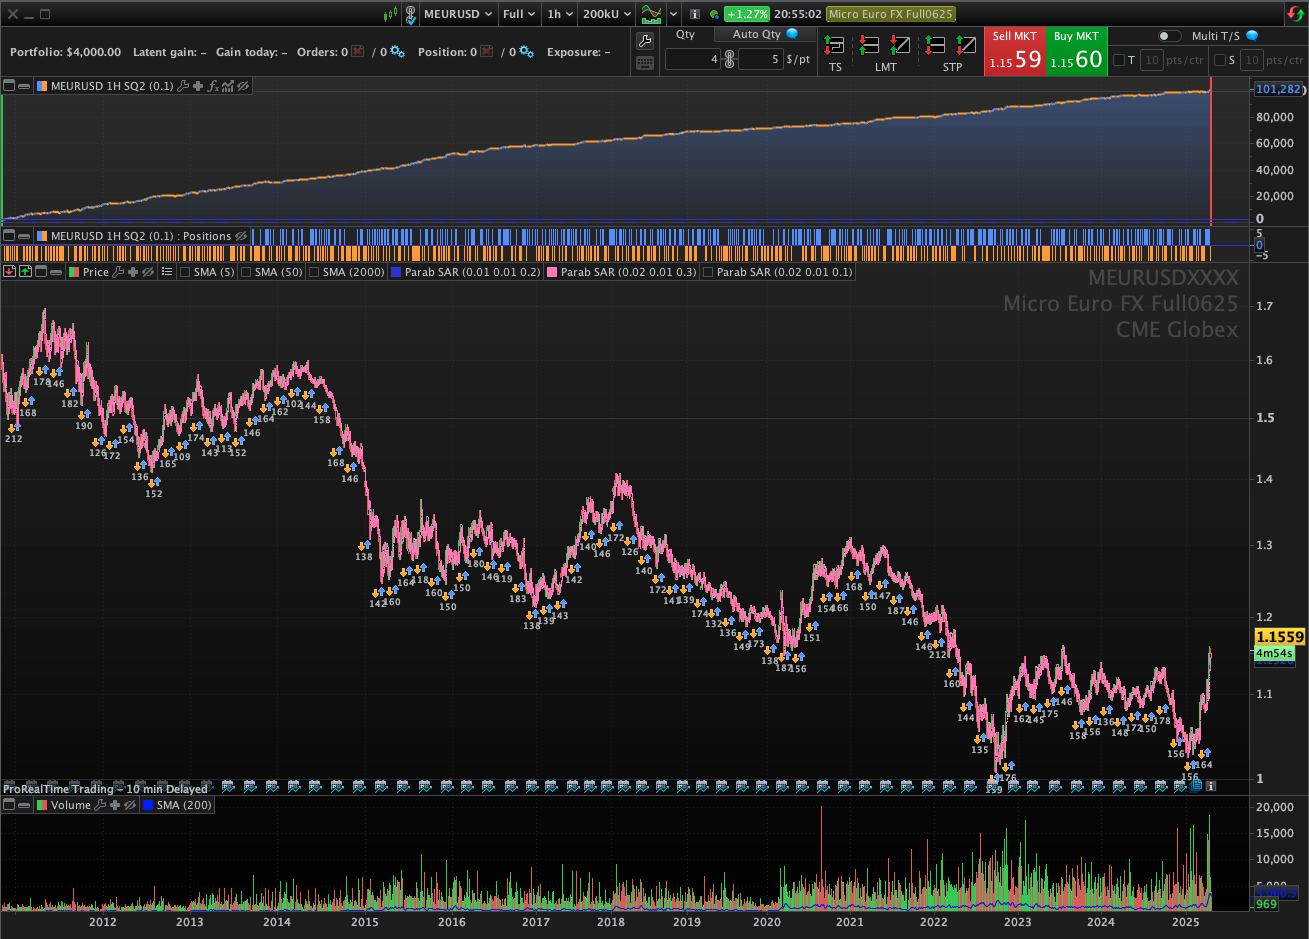
I got this system that it has a nice equity curve, and it is winner every year. However, due to my little experience on algorithmic trading and coding, i have some questions that i will appreciatte whomever can help me with.
- The system make some entries that are not reflected in the Positions Bar Graph.
- This system has a very tight stop-loss, leaving the profits run away. However, this means many a very low % of winning trades. What do you think about this type of trading systems?
- Any improve recomendation (if any).
// Estrategia Parabolic SAR y entradas dinámicas con SL y TP en %
// EUR/USD - M60

defparam cumulateorders = false
DEFPARAM FLATBEFORE = 010500
DEFPARAM FLATAFTER = 234000

// ====== PARÁMETROS ======
PriceEntryMult1 = 0.1
ProfitTarget1 = 0         // % de beneficio
StopLoss1 = 0.002         // % de pérdida

// ====== INDICADORES ======
sar1 = SAR[0.01, 0.01, 0.2]
sar2 = SAR[0.02, 0.01, 0.3]
sarEntry = SAR[0.02, 0.01, 0.1]

// ====== SEÑALES ======
longSignal = (close < sar1) and (close < sar2[1])
shortSignal = (close > sar1) and (close > sar2[1]) and not longSignal

// ====== PRECIO DE ENTRADA ======
barRange = high - low
longEntryPrice = sarEntry[2] - (PriceEntryMult1 * barRange)
shortEntryPrice = sarEntry[2] + (PriceEntryMult1 * barRange)

//if  longSignal THEN
//lsignal = 1
//else
//lsignal = 0
//ENDIF
//
//if shortSignal THEN
//ssignal = 1
//ELSE
//ssignal = 0
//ENDIF
//GRAPHONPRICE longEntryPrice
//GRAPH lsignal
//GRAPH ssignal
//GRAPH barRange

// ====== ENTRADAS ======
if longSignal then
buy 5 contract at longEntryPrice stop
set stop %loss StopLoss1
set target %profit ProfitTarget1
endif

if shortSignal then
sellshort 5 contract at shortEntryPrice stop
set stop %loss StopLoss1
set target %profit ProfitTarget1
endif

// ====== SALIDA EN VIERNES A LAS 20:40 ======
if (dayofweek = 5 and time >= 204000) then
if longonmarket then
sell at market
endif
if shortonmarket then
exitshort at market
endif
endif
Thank you very much to all the community, mostly to all those whom are always helping depite the time it takes. Really appreciating it.
Regards.
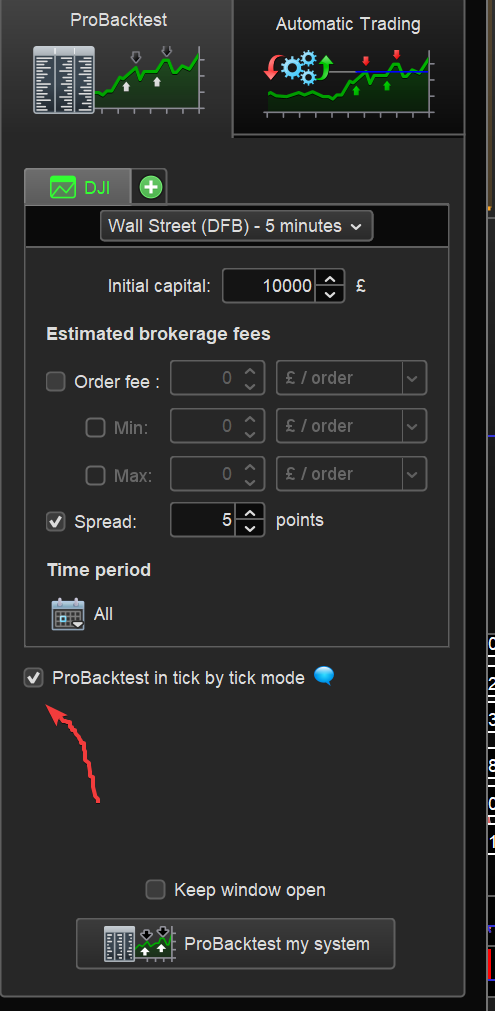
Check that you have Tick by Tick enabled as shown at the red arowhead on attached.
 JS
JSParticipant
Veteran
Hi,
Why is “ProfitTarget1=0” set to zero? (no profit?)
The “StopLoss1=0.002” is expressed as a percentage using the “Set Stop %Loss”…
Suppose the current price is 1.15, then 0.002% equals (1.15 / 100 * 0.002) = 0.000023 pips…
The minimum stop distance at IG for mini EUR/USD is 0.0002 pips…
You also have to take into account the spread, which is at least 1 pip…
When I run the system with realistic values, unfortunately, it quickly runs out of capital…
Hi guys,
Thank you very much for your time,
Check that you have Tick by Tick enabled as shown at the red arowhead on attached.
I can not find that option in my ProRealTime Complete. See the attachement “tickbytick”. However, I think it is enabled, due the trades get executed in the middle of the candles, isnt?
Why is “ProfitTarget1=0” set to zero? (no profit?)
I realized doing some tests that removing the ProfitTarget the systems is more profiable, but i wanted to leave the option.
The minimum stop distance at IG for mini EUR/USD is 0.0002 pips…
You also have to take into account the spread, which is at least 1 pip…
When I run the system with realistic values, unfortunately, it quickly runs out of capital…
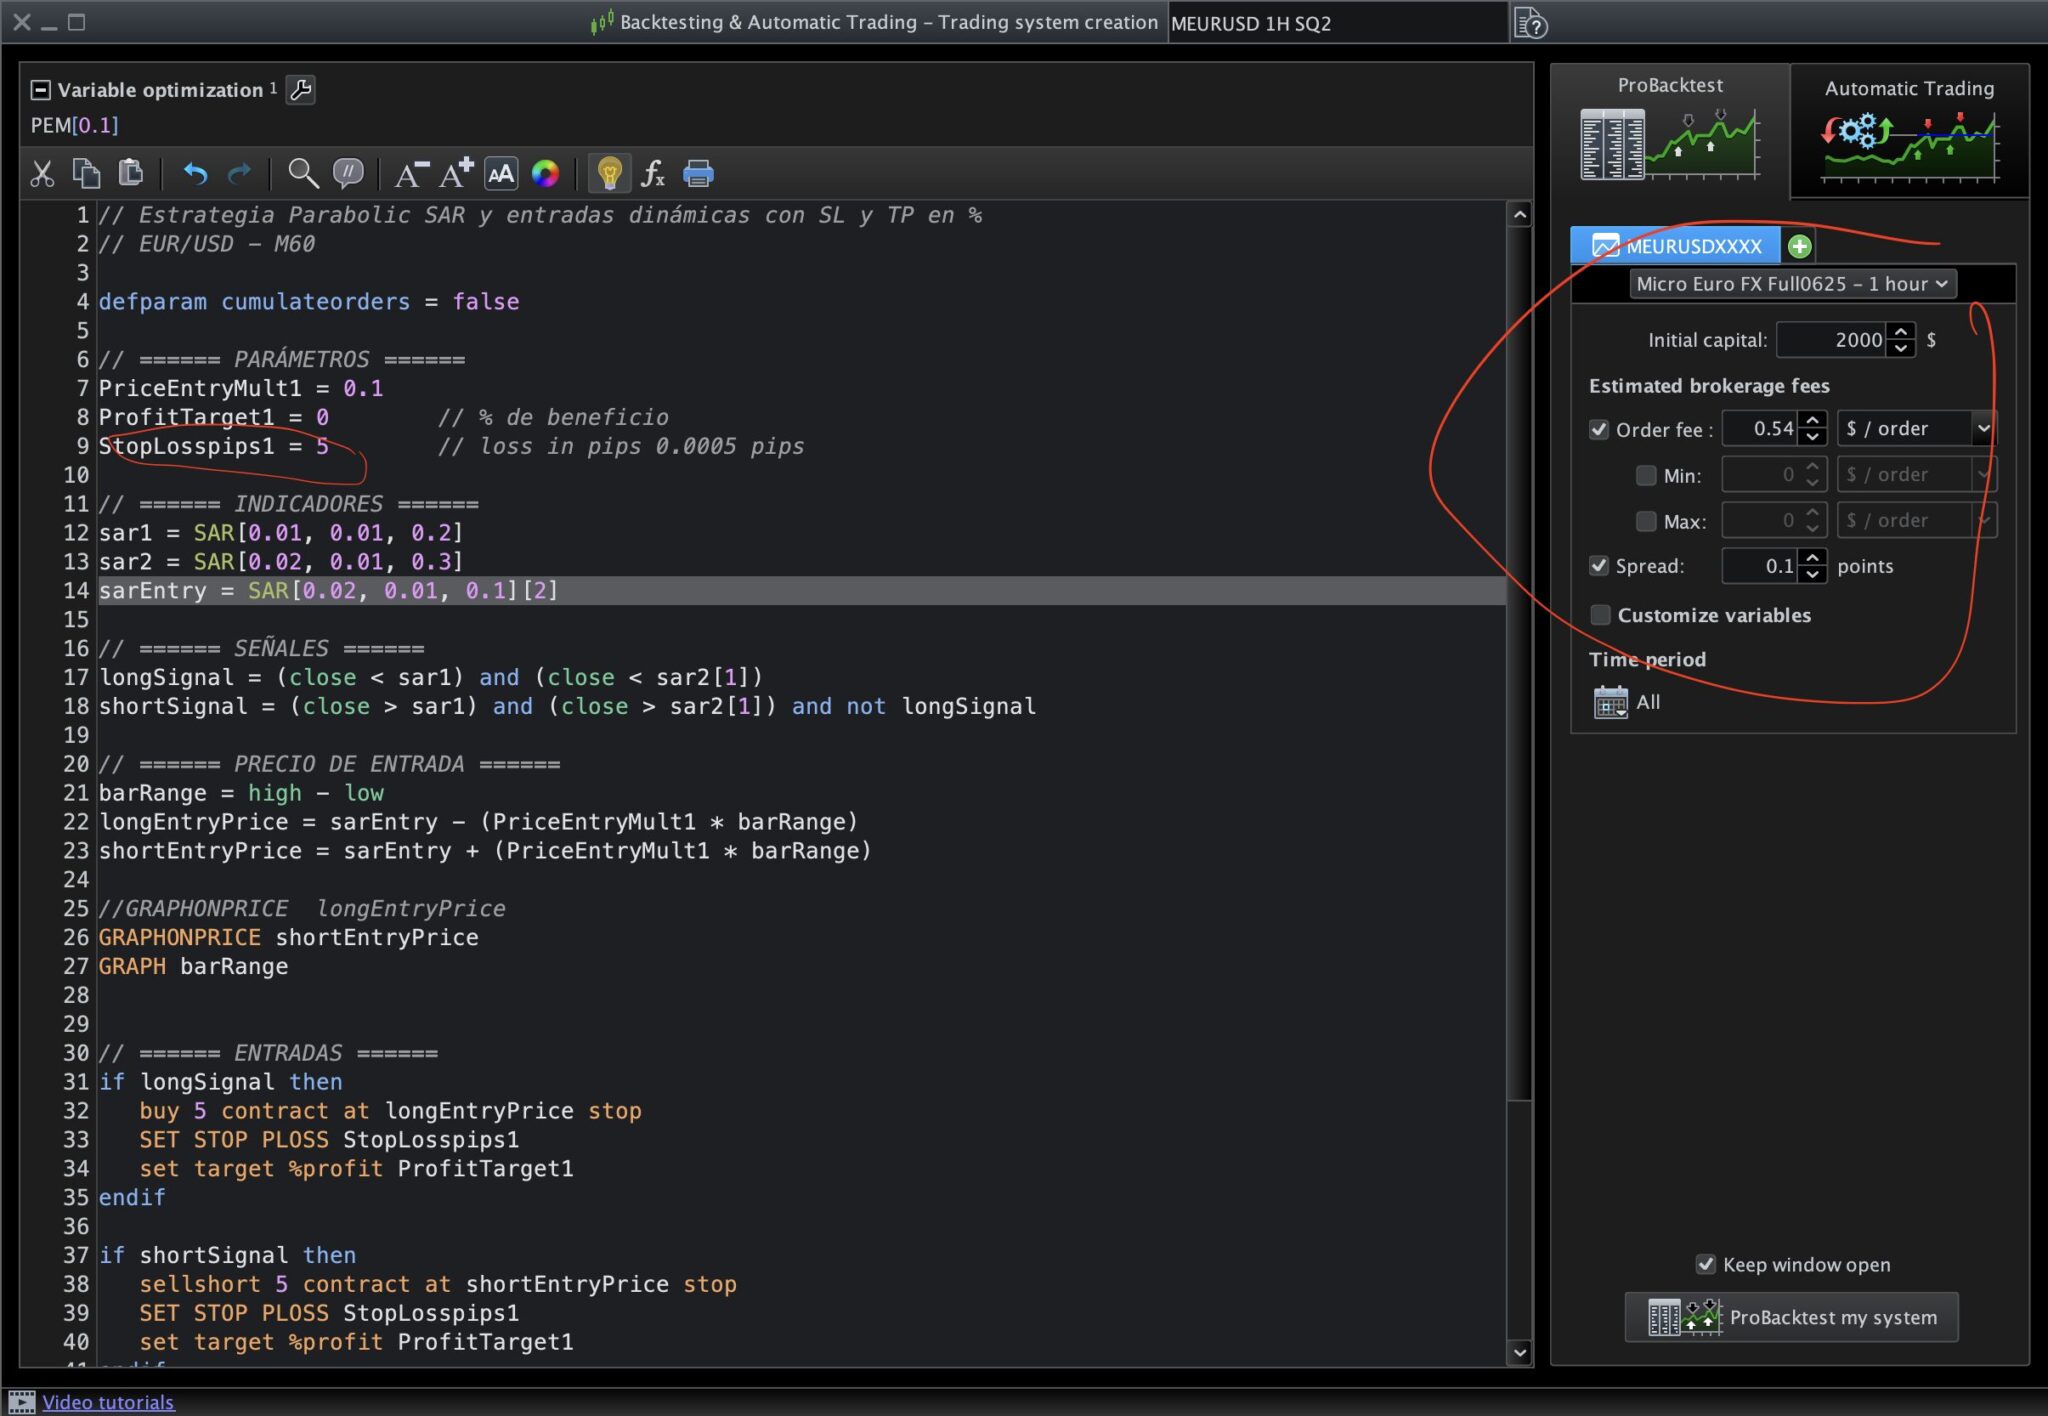
Sorry, maybe i expressed in wrongly. But the point is that I realized that with super tight SL (2 to 5 pips), the system is profitable. I changed the code to SL in pips and set 5. Also I added the minimum commision of ProRealTime for this product, and 0.1 spread. Find the attachements “SL5pipsonly” and “equity curve”.
Again thank you very much guys.
If you want to post your latest code (we can’t copy & paste from the image) then I would test on my Platform and maybe JS would also.
Re Tick by Tick mode … what version Complete are you running … as all versions should show Tick by Tick options box??
What Instrument are you testing on which has a spread of 0.1 points (which you show in backtest settings).
hi,
according your printscreens I would conclude that you don’t have tick by tick data because you did not purchase real time data for this instrument / exchange on which you are running the backtest – only if you purchase the real time data the portal will show you “tick by tick” option, otherwise not. other than that I will probably not contribute to this discussion as the strategy is linked to an indicator. anyway, here my usuall “warning” 😀 be afraid, be very afraid of such smooth equity curves 😉
regards
j
JSParticipant
Veteran
@GraHal, you can ask ChatGPT (free version) to extract the code from the picture…
Hi guys,
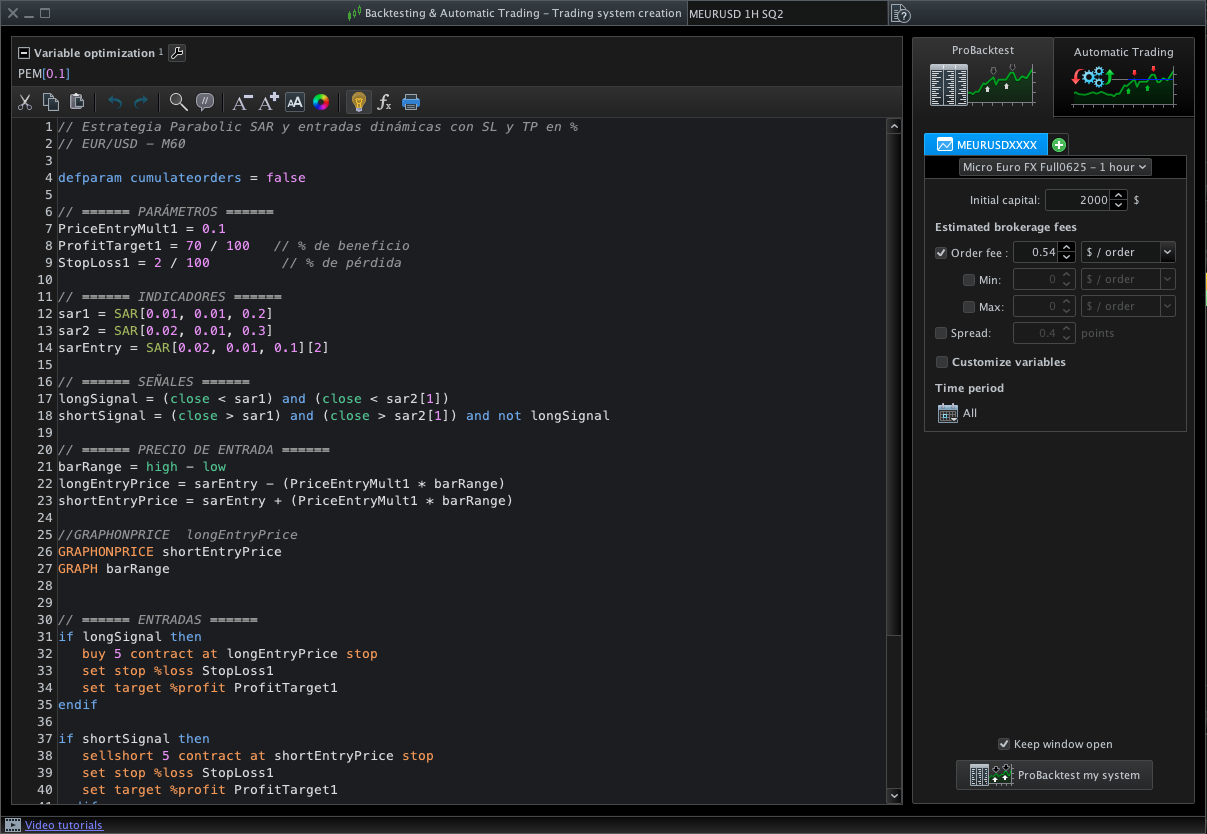
Find the code herebelow to copypaste.
// Estrategia Parabolic SAR y entradas dinámicas con SL y TP en %
// EUR/USD - M60

defparam cumulateorders = false

// ====== PARÁMETROS ======
PriceEntryMult1 = 0.1
ProfitTarget1 = 0        // % de beneficio
StopLosspips1 = 5        // loss in pips 0.0005 pips

// ====== INDICADORES ======
sar1 = SAR[0.01, 0.01, 0.2]
sar2 = SAR[0.02, 0.01, 0.3]
sarEntry = SAR[0.02, 0.01, 0.1][2]

// ====== SEÑALES ======
longSignal = (close < sar1) and (close < sar2[1])
shortSignal = (close > sar1) and (close > sar2[1]) and not longSignal

// ====== PRECIO DE ENTRADA ======
barRange = high - low
longEntryPrice = sarEntry - (PriceEntryMult1 * barRange)
shortEntryPrice = sarEntry + (PriceEntryMult1 * barRange)

//GRAPHONPRICE  longEntryPrice
//GRAPHONPRICE shortEntryPrice
//GRAPH barRange

// ====== ENTRADAS ======
if longSignal then
buy 5 contract at longEntryPrice stop
SET STOP PLOSS StopLosspips1
set target %profit ProfitTarget1
endif

if shortSignal then
sellshort 5 contract at shortEntryPrice stop
SET STOP PLOSS StopLosspips1
set target %profit ProfitTarget1
endif

// ====== SALIDA EN VIERNES A LAS 20:40 ======
if (dayofweek = 5 and time >= 204000) then
if longonmarket then
sell at market
endif
if shortonmarket then
exitshort at market
endif
endif
Hi @justisan,
Actually, I just figured out that I have the tick by tick opttiona enabled when i open CFDs forex, but not when futures.
I am using ProReaLTIme Complete in MacBook M3, with java version 21.0.4(9). I dont know if this is relevant.
Again guys, thank you for your time
JSParticipant
Veteran
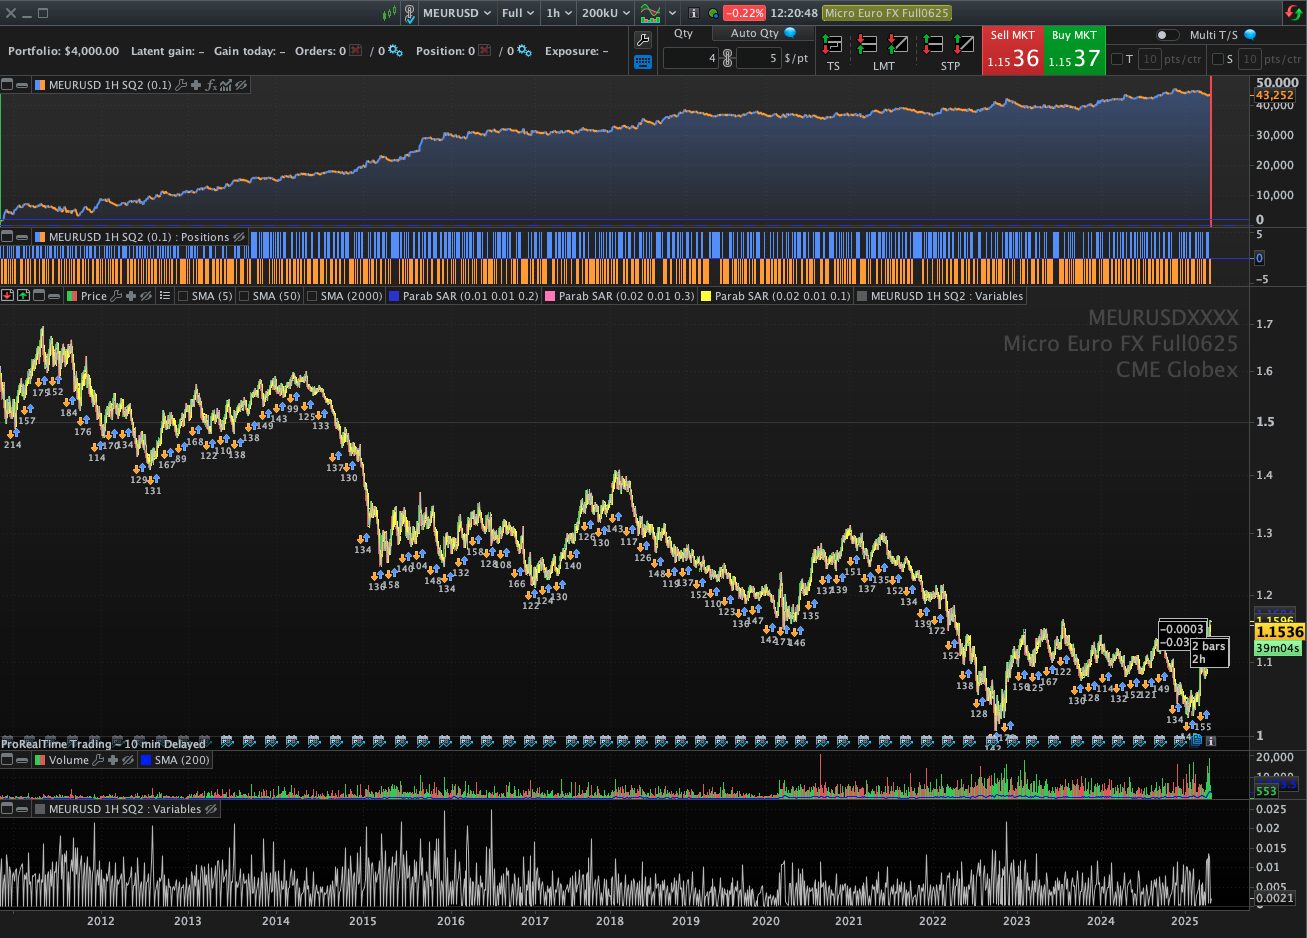
This is the result of the “BackTest tick by tick mode” with 50k units on EUR/USD mini with timeframe 1 hour… (spread 1 pip)…
hi, your screeshots indicate that your backtest is on eurusd
futures, on
cme globex exchange, and that data you use is not real-time. I mean should know if you have real-time data for this exchange or not. for futures definetely you will not have “tick by tick” backtesting option as long as you did not purchase real-time data supply.
by “your” in “your screenshots…” I meant shizophunk, his screenshots
Hi, so if i am understanding well, it is not a good idea to backtest systems with stop orders if you dont have a “tick by tick” data, right?
And this is basically because you need to know the information inside each candle to know the exact point of execution of your stop orders.
It is like this?
Yes correct … without tick by tick then PRT always assumes that Profit Target was hit first (before Stop Loss) … hence one ends up with an ideal looking equity curve when in reality, with tick by tick, the correct equity curve will be like JS posted.