Help with code for basic market modeling
Forums › ProRealTime English forum › ProBuilder support › Help with code for basic market modeling
- This topic has 12 replies, 3 voices, and was last updated 7 years ago by Nicolas.
-
-
12/30/2016 at 10:40 AM #19401
Hi!
I need some programming help since I am still building my skills.
Due to a bug in Pro Order 10.2 I started to programm indicators instead of backtests because the backtesting engine returned wrong entries and exits on the more sophisticated indicators.
It all kind of went it’s own way from there and now I use it to model markets on a basic level.
The goal is to evaluate price behavior after a specific pattern occurs (Event A).
The open of the following bar is then compared to the five following closes.
Please find this idea in Pseudocode below.
123456789If eventA[5]=1 and close[0,1,2,3,4] > open[4] thenGr = gr + 1 // gr is the good resultElseBr = br +1 //br is the bad resultEndifOne problem is:
If event A happens on two consecutive days, the code above will check the condition for the first event only once and for second event five times.
The first event is overwritten by the second. But it should also be evaluated for the next five days. To put it differently, several events of the A-Type can be going on at the same time.
I resolved this very manually by adding five separate events.
The following commented code shows the procedure for the first event and how the second event is being initiated.
123456789101112131415161718192021222324252627282930313233343536373839404142434445464748495051525354555657585960616263646566676869707172737475767778798081828384////////////////////////////////////////////////////////////////////////////////////////if (trigger and event1 = 0) or (trigger and event5 = 5) then //The trigger is the condition for the event and event1 is not in use.event1=1endif////////////////////////////////////////////////////////////////////////////////////////if event1[1] = 1 and open1 =0 thenopen1 = openflag1=0 //The flag variable is used to count only good results that are in direct relation to an event. Otherwise it will keep counting good results when the price is rising.events = events+1 //this is a counter for the number of number of currently ongoing events.endifif event1[1] = 1 and close11= 0 thenclose11 = closeendifif event1[2] = 1 and close11<>0 and open1[1]<>0 thenclose12 = closeendifif event1[3] = 1 and close12<>0 and open1[1]<>0 thenclose13 = closeendifif event1[4] = 1 and close13<>0 and open1[1]<>0 thenclose14 = closeendifif event1[5] = 1 and close14<>0 and open1[1]<>0 thenclose15 = closeendifif close11 > open1 and event1=1 and flag1 = 0 thengr1= gr1 +1 //event 1 has a good resultret1 = close11-open1+ret1 //The difference between the close and the open is the result.flag1=1 //This is actually a break in one of the loops. If the next close is also higher it is not counted as "gr".gr11=gr11+1 //This is a counter for the first event being a "good result" on the first bar.done1=1 // Resets the variables related to event1.elsif close12 > open1 and event1=1 and flag1 = 0 thengr1= gr1 +1ret1 = close12-open1+ret1flag1=1gr12=gr12+1done1=1elsif close13 > open1 and event1=1 and flag1 = 0 thengr1= gr1 +1ret1 = close13-open1+ret1flag1=1gr13=gr13+1done1=1elsif close14 > open1 and event1=1 and flag1 = 0 thengr1= gr1 +1ret1 = close14-open1+ret1flag1=1gr14=gr14+1done1=1elsif close15 > open1 and event1=1 and flag1 = 0 thengr1= gr1 +1ret1 = close15-open1+ret1flag1=1gr15=gr15+1done1=1endif//Code for clearing the variables AND accounting for a bad result, since all five closes were below "open1".if event1[6]= 1 and event1[5]=1 and event1[4]=1 and event1[3]=1 and event1[2]=1 and event1[1]=1 or done1=1 thenevent1=0if flag1=0 then //in case a good result occurs the flag is set to one.br1 = br1+1 //flag is zero after all periods, so it is a bad result.flag1 = 1ret1 = ret1+(close15-open1)endifopen1 = 0close11 = 0close12 = 0close13 = 0close14 = 0close15 = 0done1=0events = events-1endif///////////////////////////////////////////////////////////////////////////////////////////EVENT 2////////////////////////////////////////////////////////////////////////////////////////if trigger and event1[1]=1 thenevent2=2endifAt the end all of the results are summed up:
1234gr=gr1+gr2+gr3+gr4+gr5br=br1+br2+br3+br4+br5ret=ret1+ret2+ret3+ret4+ret5binprob=gr/(br+gr)The return and the binprob variables are the starting points for actual evaluation and analysis. They provide a basic insight into the price movement that follows event A and return a winning-losing probability for this type of event and time span.
As you can see it is difficult to add more events and more bars following the initial event. Can you show me how to resolve this? Maybe put this procedure into proper loops?
Ultimately I want to add another event B following event A. This would be something along the lines of:
If the price crosses above the five days moving average look for a´close higher than tomorrows open within the next five days. But if the price crosses below the 5 days moving average before the good result occurs check if there will be a close below tomorrows open within the next five days following the second cross.
01/01/2017 at 10:59 AM #19540Hi Derek,
I must admit that read and understand the code you have posted is a bit tricky .. 🙂
Please don’t be offend, but in order to help you in the most effective way, I believe I should rebuild the whole code in a proper coding way (and it will also be easier and quicker for me).
Would you mind telling me what is the “eventA” please? I need to start with a good knowledge of the whole plan! Thanks in advance.
01/01/2017 at 12:04 PM #19545Hi Nicolas,
thank you for offering your support and I surely am rather thankfull.
It does not matter what event A is but I have been using John Ehlers Supersmoother from the library.
The condition is S > S[1].
1234567891011Period = 8Data = ClosePI = 3.14159f = (1.414*PI) / Perioda = exp(-f)c2 = 2*a*cos(f)c3 = -a*ac1 = 1 - c2 - c3if barindex>Period thenS = c1*(Data[0]+Data[1])*0.5 + c2*S[1] + c3*S[2]endif01/02/2017 at 7:58 PM #19654Hello Nicolas,
let me try to explain in a different way what this is supposed to be.
I consider it to be more of a universal tool for statistical analysis than an actual indicator or even a handicapped backtest. There is a good result (the condition has been meet after X days) and the corresponding bad result. If I look at todays price chart and ask myself: What is the right side of this market?” the binprob variable can provide an easy insight into the patterns just observed on the chart.
For example:
If the price crosses over the Supersmoother what is the probability that the price will (still) be above the indicator in 1,2,3,4,5..X days? If I want to enter a market and the price has been above the indicator for 6 days already does this mean I could also wait for 3-4 days more and hope for a pullback with a 70-80% probability? Thus telling me in which direction I should enter and when a good moment could be comming up?
The condition to be checked (price above the supersmoother) can easily be adapted to many different needs. In return this indicator can provide a probability distribution for the request.
Another example are the many forum posts asking for a exit condition after 3 bars. Why 3 bars and not five? The return function can provide an insight into the expected return for every following day.
I hope this helps you a bit better to understand where this is going.
In an optimal world those results could be exported into a spreadsheet 🙂 Anyways in my view it is a little swiss army knife and surely think that other users can profit from this, too.
02/01/2017 at 3:52 AM #23363Hello! A late reply from me here, but an interesting problem. Did you manage to solve it? Was the indicator/system of any use in terms of edge?
I have created similar systems based on a similar technique (basic form of machine learning). This is tricky to do in PRT, but possible.
1 user thanked author for this post.
02/01/2017 at 9:25 AM #2337702/01/2017 at 9:50 PM #2349102/01/2017 at 9:50 PM #2349202/02/2017 at 9:44 AM #23515Sorry, I just read again the whole thread, it will not be helpful for your statistical analysis tool. I’m jumping from topic to topic, so sometimes I should refresh my ideas 🙂
For example: If the price crosses over the Supersmoother what is the probability that the price will (still) be above the indicator in 1,2,3,4,5..X days? If I want to enter a market and the price has been above the indicator for 6 days already does this mean I could also wait for 3-4 days more and hope for a pullback with a 70-80% probability? Thus telling me in which direction I should enter and when a good moment could be comming up?
If I’m referring to this example, all we need to do is to count how much bars were above since the last cross of Close above the Supersmoother curve? No matter if a candle Close was above or below the previous one, etc. only a count above/below Supersmoother?
02/02/2017 at 1:14 PM #23559@Nicolas:That’s more like it.
The price crossing the Supersmoother is an event or a condition. The question is: What is the probability that the event will still be true in X bars?
So, maybe, the code has to start from the bar when prices crosses UNDER the Supersmoother and then look back how many bars the price was above the Supersmoother. The direction of the price does not matter.
Every time the price crosses ABOVE the Supersmoother the number of events observed increases ( event = event +1).
Every time the price was above the Supersmoother for longer than X bars it was a good event ( good event +1).
Good event / event = Probability
02/02/2017 at 1:42 PM #23572Something like this?
123456789101112131415161718192021222324Period = 8Data = ClosePI = 3.14159f = (1.414*PI) / Perioda = exp(-f)c2 = 2*a*cos(f)c3 = -a*ac1 = 1 - c2 - c3if barindex>Period thenS = c1*(Data[0]+Data[1])*0.5 + c2*S[1] + c3*S[2]endifif close crosses over S thenevent=event+1overbar = barindexendifif close crosses under S thengoodevent = goodevent+(barindex-overbar)endifstats = goodevent/eventreturn stats02/02/2017 at 6:26 PM #23658That is quite something Nicolas. Thank you.
Please find my version of the stats variable below.
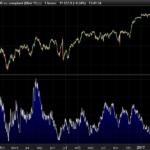
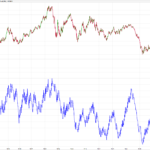
1234567891011121314151617181920212223242526272829303132333435Period = 8Data = ClosePI = 3.14159f = (1.414*PI) / Perioda = exp(-f)c2 = 2*a*cos(f)c3 = -a*ac1 = 1 - c2 - c3if barindex>Period thenS = c1*(Data[0]+Data[1])*0.5 + c2*S[1] + c3*S[2]endifonce duration = 0if close crosses over S thenevent=event+1overbar = barindexendifif close crosses under S thenunderbar = barindexduration = underbar-overbarcalc = 1elsecalc = 0//goodevent = goodevent+(barindex-overbar)endifif calc = 1 and duration > 4 thengoodevent = goodevent + 1endifstats = goodevent/eventreturn statsIn the attached screenshot you can see that a lower high of the stats variable can be a reasonable indicator for a downswing and a higher low an indicator for the corresponding upswing. A long flat top of the indicator could be the end of a major trend.
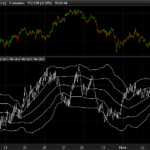
02/02/2017 at 7:57 PM #23682Purely statistical speaking, you can now add a moving average with a period of your choice with standard deviation from it :1 and 2
123456789101112131415161718192021222324252627282930313233343536373839404142434445Period = 8Data = ClosePI = 3.14159f = (1.414*PI) / Perioda = exp(-f)c2 = 2*a*cos(f)c3 = -a*ac1 = 1 - c2 - c3if barindex>Period thenS = c1*(Data[0]+Data[1])*0.5 + c2*S[1] + c3*S[2]endifonce duration = 0if close crosses over S thenevent=event+1overbar = barindexendifif close crosses under S thenunderbar = barindexduration = underbar-overbarcalc = 1elsecalc = 0//goodevent = goodevent+(barindex-overbar)endifif calc = 1 and duration > 4 thengoodevent = goodevent + 1endifstats = goodevent/eventmeanP = 500if barindex>500 thenmean = average[meanP](stats)std1up = mean+std[meanP](stats)std1dn = mean-std[meanP](stats)std2up = mean+std[meanP](stats)*2std2dn = mean-std[meanP](stats)*2endifreturn stats, mean, std1up,std1dn,std2up,std2dn -
AuthorPosts
Find exclusive trading pro-tools on