FANTASTIC, Vonasi,
Haha…..yes everything is easy ;-), when you know how to do it.
But yes, this is what I was looking for. We have a break through.
And the next step is to switch between Cycle Lows and Cycle Highs 🙂
I could write the code in about two minutes but I’m guessing that you’d prefer to have a go yourself first as otherwise it would be like getting the teacher to do your homework!
Please let me do it myself. I will keep you informed.
I have loaded the indicator in the chart for the lowest Price and in the MACD for the lowest MACD.
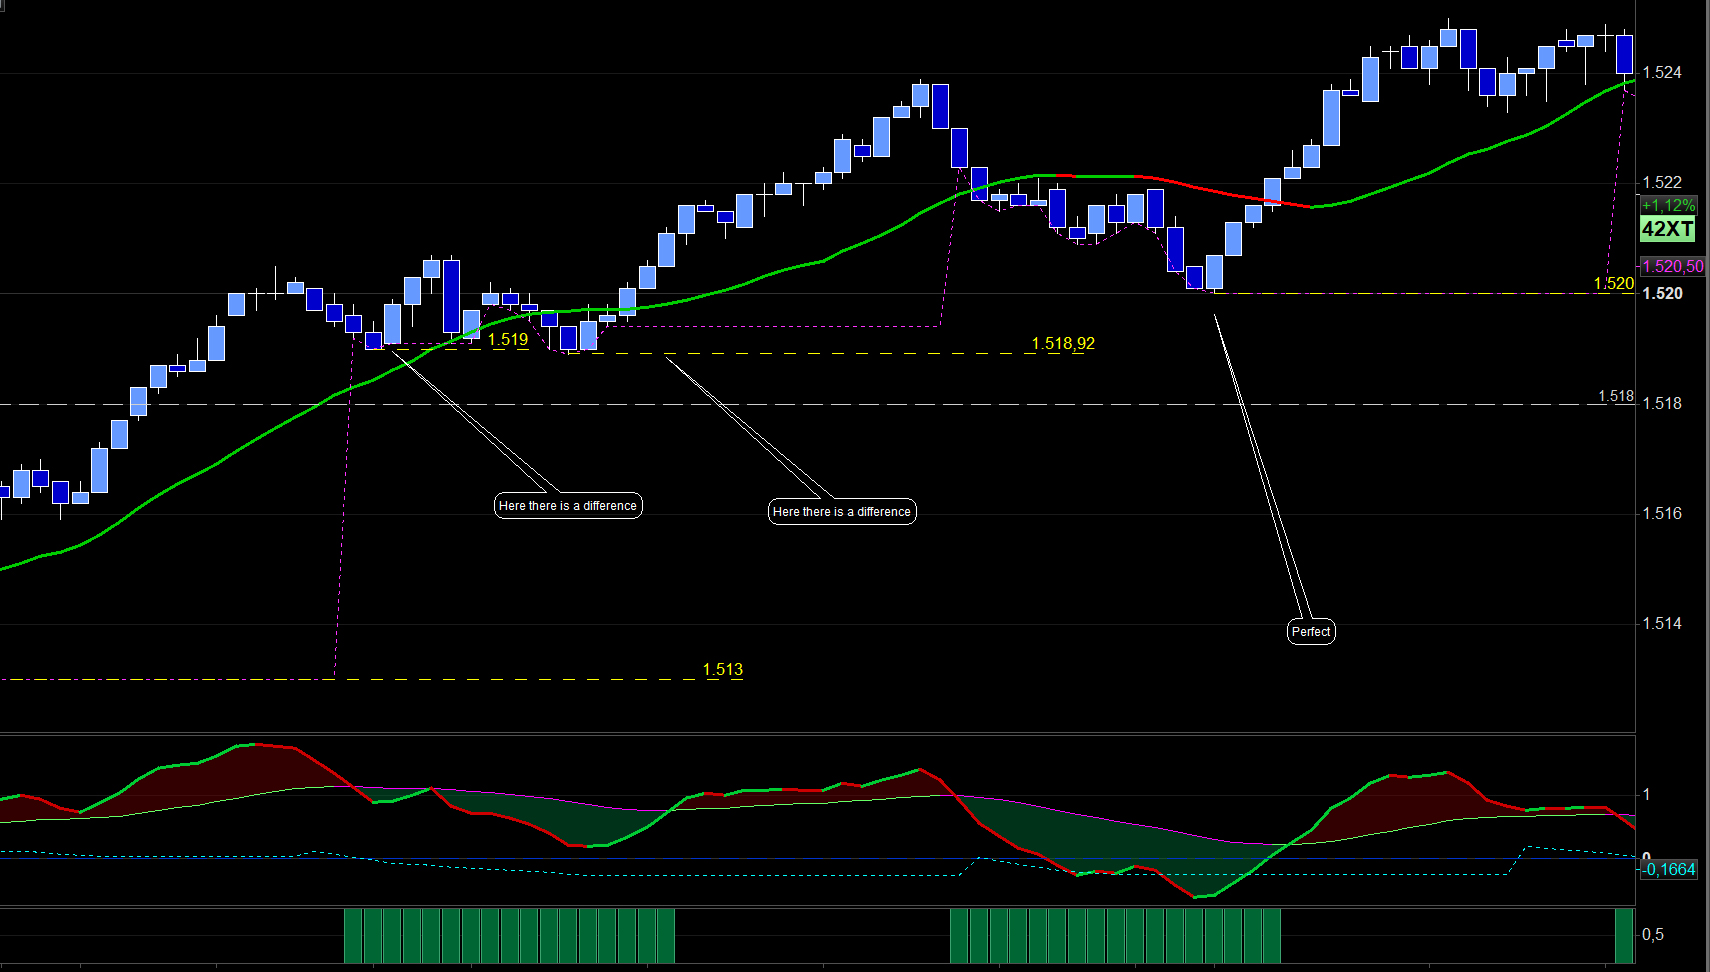
I still see some hesitations. See my attachment.
.
Below the MACD you see the histogram of the candles/period of the cycle low..
I see there is a moment where there are 2 cycle lows next to each othere, but in both it doesn’t take the lowest Price..
In the MACD below the chart, I made the lowest MACD in cycle light blue dashed. That doesn’t fit with the real lowest MACD in cycle.
.
Do I overlook something?
Sorry, here the attachment.
Ah,,, I see what happens, it takes the low at the bar of the lowest MACD, instead of the lowest price within the cycle low. That might be on the bar of the lowest MACD, but doesn’t need to be like that.
Yes – I thought that was what you said you wanted – but I did wonder. So you really want the lowest price during the cycle – not the lowest price at the lowest MACD in the cycle? That’s easily fixed.
macdl = macdline[12,26,9]
macds = exponentialaverage[9](macdl)

//start of cycle
If macdl < macds and macdl[1] > macds[1] then
macdlowest2 = macdlowest
lowestprice2 = lowestprice
incycle = 1
macdlowest = macdl
LowestPrice = low
endif

//Eend of cycle
If macdl > macds and macdl[1] < macds[1] then
incycle = 0
endif

//lowest macd and price in cycle
if incycle then
macdlowest = min(macdlowest, macdl)
lowestPrice = min(lowestprice, low)
endif

return macdlowest as "lowest macd in cycle", lowestprice as "lowest price in cycle", macdlowest2 as "previous lowest macd in cycle", lowestprice2 as "previous lowest price in cycle"
Yes, with an extra endif after line 22 that works perfectly for the lowest price. But for the lowest of the MACD I still have some problems.
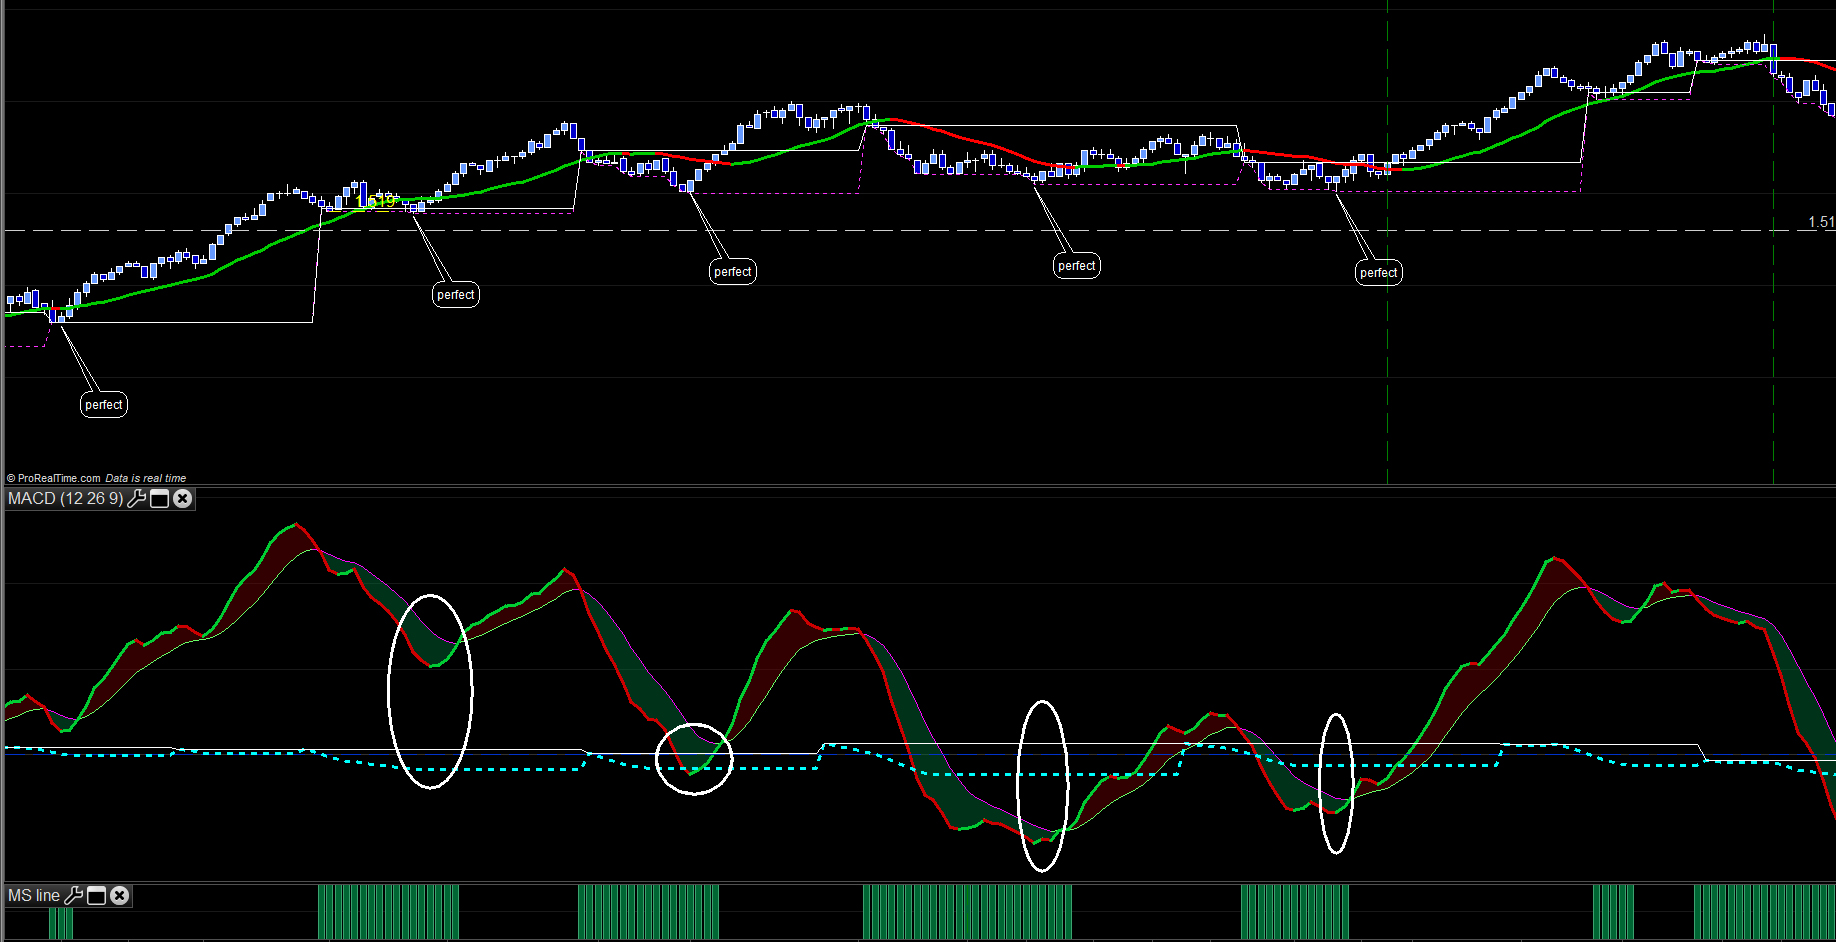
See thee attachement. The lowest prices are perfect, but the MACD is still not right, see the ellipses in the image. The light blue dashed line in the MACD is the lowest MACD of the indicator.
The line of the lowest price in cycle works perfect.
The line of the previous loweste price doesn’t make any sense to me. 🙂
Add the indicator directly into your chart and make the lowest MACD end the previous lowest MACD invisible.
And Add the indicator directly into you MACD and make the lowest price and the previous lowest price invisble.
Then the indicator is the best visible to test it.
Sorry for the many posts.
It works with the MACD lowest when I add it as a seperate indicator. The I see the lowest macd in cycle is the lowest macd from the last finished cycle low. When I add the indicator into the MACD itself, then it makes something totally different out of it.
The previous lowest in the MACD, I don’t understand what comes out of that. But that doesn’t matter to me, because what I need to see is shown in the lowest MACD. So I switch that to invisible.
I was just about to post to say that I found exactly the same problem. Plotting on the MACD indicator does not seem to work correctly.
It is best to draw your own MACD so I adapted the code this to prove that the positions were all correctly identified:
macdl = macdline[12,26,9]
macds = exponentialaverage[9](macdl)

//start of cycle
If macdl < macds and macdl[1] > macds[1] then
macdindex2 = macdindex
lowindex2 = lowindex
//macdlowest2 = macdlowest
//lowestprice2 = lowestprice
drawvline(macdindex) coloured(0,0,255)
drawvline(macdindex2) coloured(0,0,0)
drawvline(lowindex) coloured(255,0,0)
drawvline(lowindex2) coloured(0,255,0)
incycle = 1
macdlowest = macdl
LowestPrice = low
endif

//Eend of cycle
If macdl > macds and macdl[1] < macds[1] then
incycle = 0
endif

//lowest macd and price in cycle
if incycle then
macdlowest = min(macdlowest, macdl)
lowestPrice = min(lowestprice, low)
if macdlowest = macdl then
macdindex = barindex
endif
if lowestprice = low then
lowindex = barindex
endif
endif

return macdl, macds//macdlowest as "lowest macd in cycle", macdlowest2 as "previous lowest macd in cycle", lowestprice as "lowest price in cycle", macdlowest2 as "previous lowest macd in cycle", lowestprice2 as "previous lowest price in cycle"
I saw that the values are correct in the indicator when I inserted it as an individual indicator, not when I inserted it into the MACD-indicator.
I have also made the cycle high version :-). It works.
I am now gonna work on how to make the indicator better readable.
I keep you posted.
Thanks a lot Vonasi for your patience and your passion,
Marc
Good morning,
I have a few questions….still.
-Which vlines are the the ones inline 13 and line 15? They mark the bar with the lowest Macd before the next bar with the lowest MACD in the cycle, right? Are these interesting?Is there a reason you gave them a vline?
And….
Is there a way to name the lowestprice of the last cycle low and the lowest price of the cycle low befor the last cycle low.
.
So I can drawtext when…………… the lowest price of the cycle low [1] < the lowestprice of the cycle low
The same with the macdl.…………. the lowest macdl of the cycle low [1] < the lowest macdl of the cycle low
.
Actually don’t want to see all the movements from from the lowest prices and macdl’s. It makes the chart so noisy. I am only interested actual bars.
I tell you the end result I am working on.
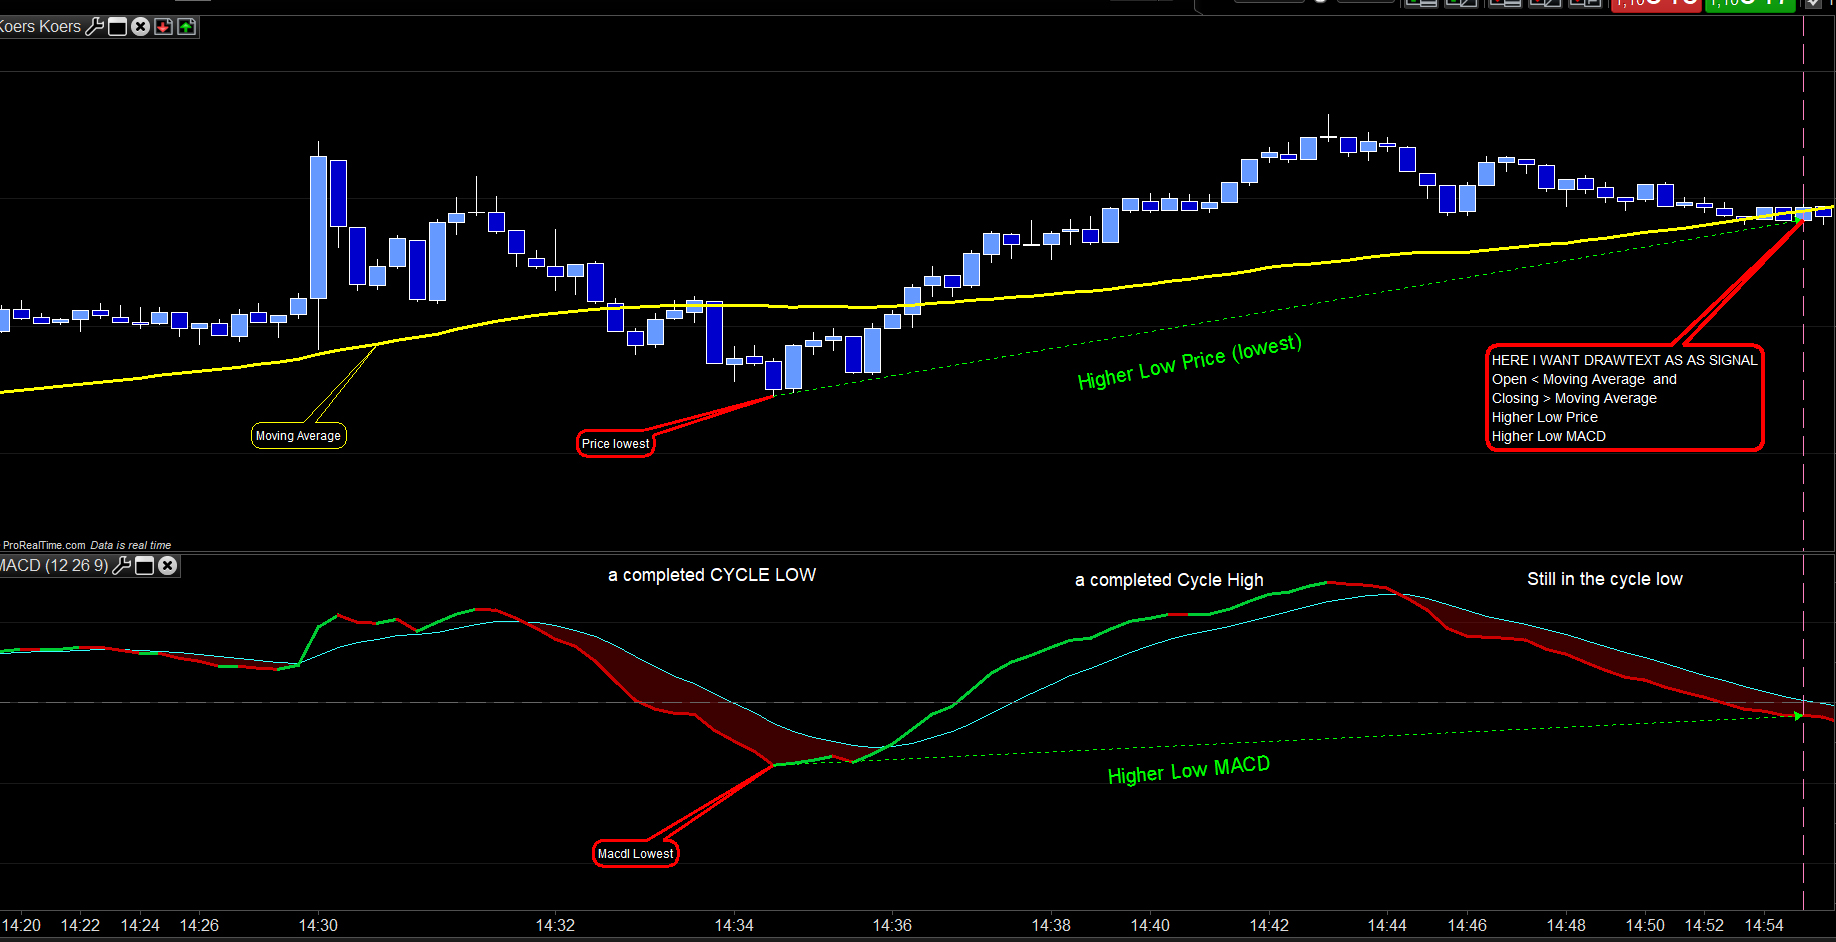
if open < sma50 and close > sma50 and macdl > macdlowest from the last cycle low and low > lowest of the last previous cycle low then
DRAWTEXT…….
This is the only place where I want something to see in my chart.
I included this allready some post befor, but here again in the image.
I chose vertical lines because… well because I just did! No real reason.
You can draw arrows or write text wherever you like on a chart. See DRAWTEXT and DRAWARROWUP, DRAWARROWDOWN etc in the documentation.
Here is the cycle low code with arrows added when the conditions you describe are met.
Apply it directly to the price chart using the wrench/spanner in the corner
macdl = macdline[12,26,9]
macds = exponentialaverage[9](macdl)

//start of cycle
If macdl < macds and macdl[1] > macds[1] then
macdlowest2 = macdlowest
lowestprice2 = lowestprice
incycle = 1
macdlowest = macdl
LowestPrice = low
endif

//end of cycle
If macdl > macds and macdl[1] < macds[1] then
incycle = 0
endif

//lowest macd and price in cycle
if incycle then
macdlowest = min(macdlowest, macdl)
lowestPrice = min(lowestprice, low)

c1 = open < average[50](close)
c2 = close > average[50](close)
c3 = macdlowest > macdlowest2
c4 = lowestprice > lowestprice2

if c1 and c2 and c3 and c4 then
drawarrowup(barindex,low)coloured(0,128,0)
endif
endif

return
Note: code edited at 1102 to correct averages.