highest high in a specific time range and timeframe

Viewing 6 posts - 1 through 6 (of 6 total)
  • Author
    Posts
  • #156809 quote
    joepetting
    Participant
    Average

    hi to all,

    i am new here and start to learn programming to make my own indicators.

    I hope someone can help me with my actual problem.

    • i search the highest high and the lowest low on the 15 minutes chart between 8 and 9 o’clock
    • the problem is that i get all the highs and lows from every candle in this timerange

    thanks for the help in advance

    kind regards

    defparam calculateonlastbars = 100
    
    if time > 080000 and time < 090000 then
    HighestH = high //max(high,high)
    LowestL = low //min(low,low)
    
    //UpperRange = HighestH < HighestH[1] and HighestH > HighestH[2]
    //BottomRange = LowestL > LowestL[1] and LowestL < LowestL[2]
    endif
    
    //if currentdayofweek = 1 or 2 or 3 or 4 or 5 then
    
    drawray(barindex-1,HighestH,HighestH,HighestH) coloured(0,200,0) STYLE(line,2)
    
    drawray(barindex-1,LowestL,LowestL,LowestL) coloured(200,0,0) STYLE(line,2)
    
    //endif
    
    return
    #156819 quote
    robertogozzi
    Moderator
    Legend

    At line 3 you should use >= and <=.

    Lines 4-5 must be replaced by:

    HighestH = max(high,HighestH)
    LowestL  = min(low,LowestL)

    but you also need to reset them each day, at the beginning of the code, at line 2:

    If IntraDayBarIndex = 0 then
       HighestH = 0
       LowestL  = 999999
    endif
    #156907 quote
    joepetting
    Participant
    Average
    defparam calculateonlastbars = 100
    
    If IntraDayBarIndex = 0 then
    HighestH = 0
    LowestL  = 99999
    endif
    
    if time >= 080000 and time <= 090000 then
    HighestH = max(high,HighestH)
    LowestL = min(low,LowestL)
    endif
    
    drawray(barindex-1,HighestH,HighestH,HighestH) coloured(0,200,0) STYLE(line,2)
    
    drawray(barindex-1,LowestL,LowestL,LowestL) coloured(200,0,0) STYLE(line,2)
    
    return

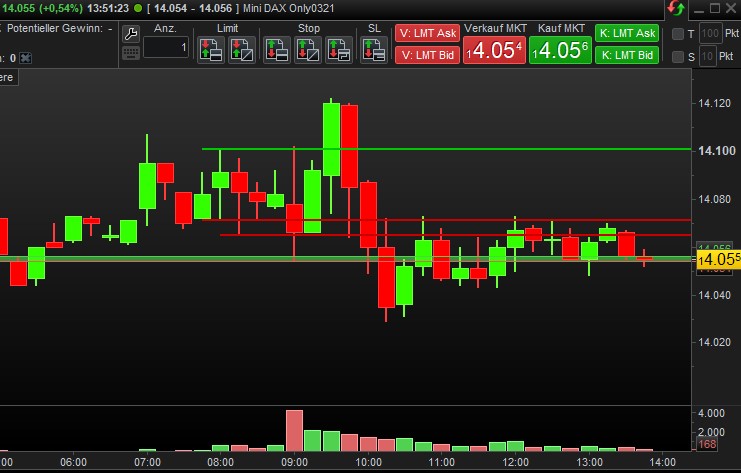
    hi thanks for your help, i changed the code but its not working. attached is pictures of the result (chart) there should be only to lines

    one upper and one bottom line.   kind regards

    Screenshot-2021-01-08-135426.jpg Screenshot-2021-01-08-135426.jpg
    #156915 quote
    robertogozzi
    Moderator
    Legend

    You need to use as first or second line:

    Defparam DrawOnLastBarOnly = true
    #156921 quote
    Nobody
    Participant
    Veteran

    try replacing max with highest and min with lowest and see how it goes

    #156922 quote
    joepetting
    Participant
    Average

    thanks it works, now i can go on with it

Viewing 6 posts - 1 through 6 (of 6 total)
  • You must be logged in to reply to this topic.

ProRealAI ProRealAI New

Stuck on this ProBuilder code?

Describe what this topic is trying to build, in plain English, and ProRealAI writes the ProRealTime™ indicator, screener or system for you.

Available in 7 languages
Try ProRealAI

highest high in a specific time range and timeframe


ProBuilder: Indicators & Custom Tools

New Reply
Author
author-avatar
joepetting @joepetting Participant
Summary

This topic contains 5 replies,
has 3 voices, and was last updated by joepetting
5 years, 8 months ago.

Topic Details
Forum: ProBuilder: Indicators & Custom Tools
Language: English
Started: 01/07/2021
Status: Active
Attachments: 1 files
Logo Logo
Loading...