Hi Roberto,
Maybe It did not explain correctly.
I post the RSI inidicator mutitimeframe: It diplays lower RS timeframes in higuer timeframes.
You can check the post:
https://www.prorealcode.com/topic/multitimeframe-indicator/
I would like to know if it is posible to do the same with the simple average. You said that it is not possible with Graphonprice instruction..
Thanks in advance
I woud like to plot the 1 hour average as it is in the 1 hour graph.
Plotting a 1-hour average on a 1-hour chart is simple, just add it to your chart.
Plotting a 4-hour average on a 1-hour chart is possible with GRAPHONPRICE and ProBackTest
Plotting a 1-hour average on a 4-hour chart makes no sense to me, but you can achieve that by dividing the periods (a 20 period 1-hour average would become a 5-period 4-hour average) but it wouldn’t be exactly the same!
Having 1 hour 200 average in a 4 hour chart it is something very imprtant to have for me.
So I guess that it is not possible to recode the RSI multitimeframe to be Average.
Thanks
Try this:
//higher timeframe minutes count
HigherTFminutes = 60

//current timeframe minutes count
CurrentTFminutes = 240

//RSI period to display
RSIperiod = 200

if hour<>hour[1] then
c = close
endif

currentRSI = average[RSIperiod](close)

factor = ROUND(HigherTFminutes/CurrentTFminutes)


MTFRSI = RSI[RSIperiod*factor](c)


RETURN currentRSI as "current TF RSI", MTFRSI as "higher TF RSI"
If you want, you can replace any occurrence of the letters RSI with AVG.
Thank youI have tried but it claims that Average needs apositive rounded number.
I ave tried to modify it with no luck.
Thanks in advance
I’m with Roberto on this one – I don’t understand what you will achieve by putting a 1 hour average on a four hour chart. While a four hour candle is forming four 1 hour candles will open and close. When the four hour candle closes you are left with a line that just represents what the 1 hour average was at the close of the last hour of that four hour period. Nothing will be displayed that represents the first three hours.
Thanks Roberto.
The 200 Average in 60 miutes chart is a suport or resistance line more important than the 200 average in te 4 hours chart.
As I am trading in the 4 hours chart, It will be perfect to have the 1 hour 200 simple average plotted in the 4 hours chart!
Thanks in advance
Try replacing lines 18-19 with:
x = max(1,round(RSIperiod*factor))
MTFRSI = RSI[x](c)
I dont know your system but I would default to the H1 chart , plot the H1 200 SMA in H1 and use the powerful multimeframe instructions ( in your case timeframe(4 hours,updateonclose) I guess) to get whatever H4 data your system uses.
No, he needs to use a 4-hour chart and wants to plot the 1-hour average on it.
It’s just a matter of doing some math, though the results won’t be the same as having ProBuilder support multiple time frames (as I hope it will be in the future).
Hi,
It is not working; I have tried to unserstand and modify it with no luck.
Thanks in advance
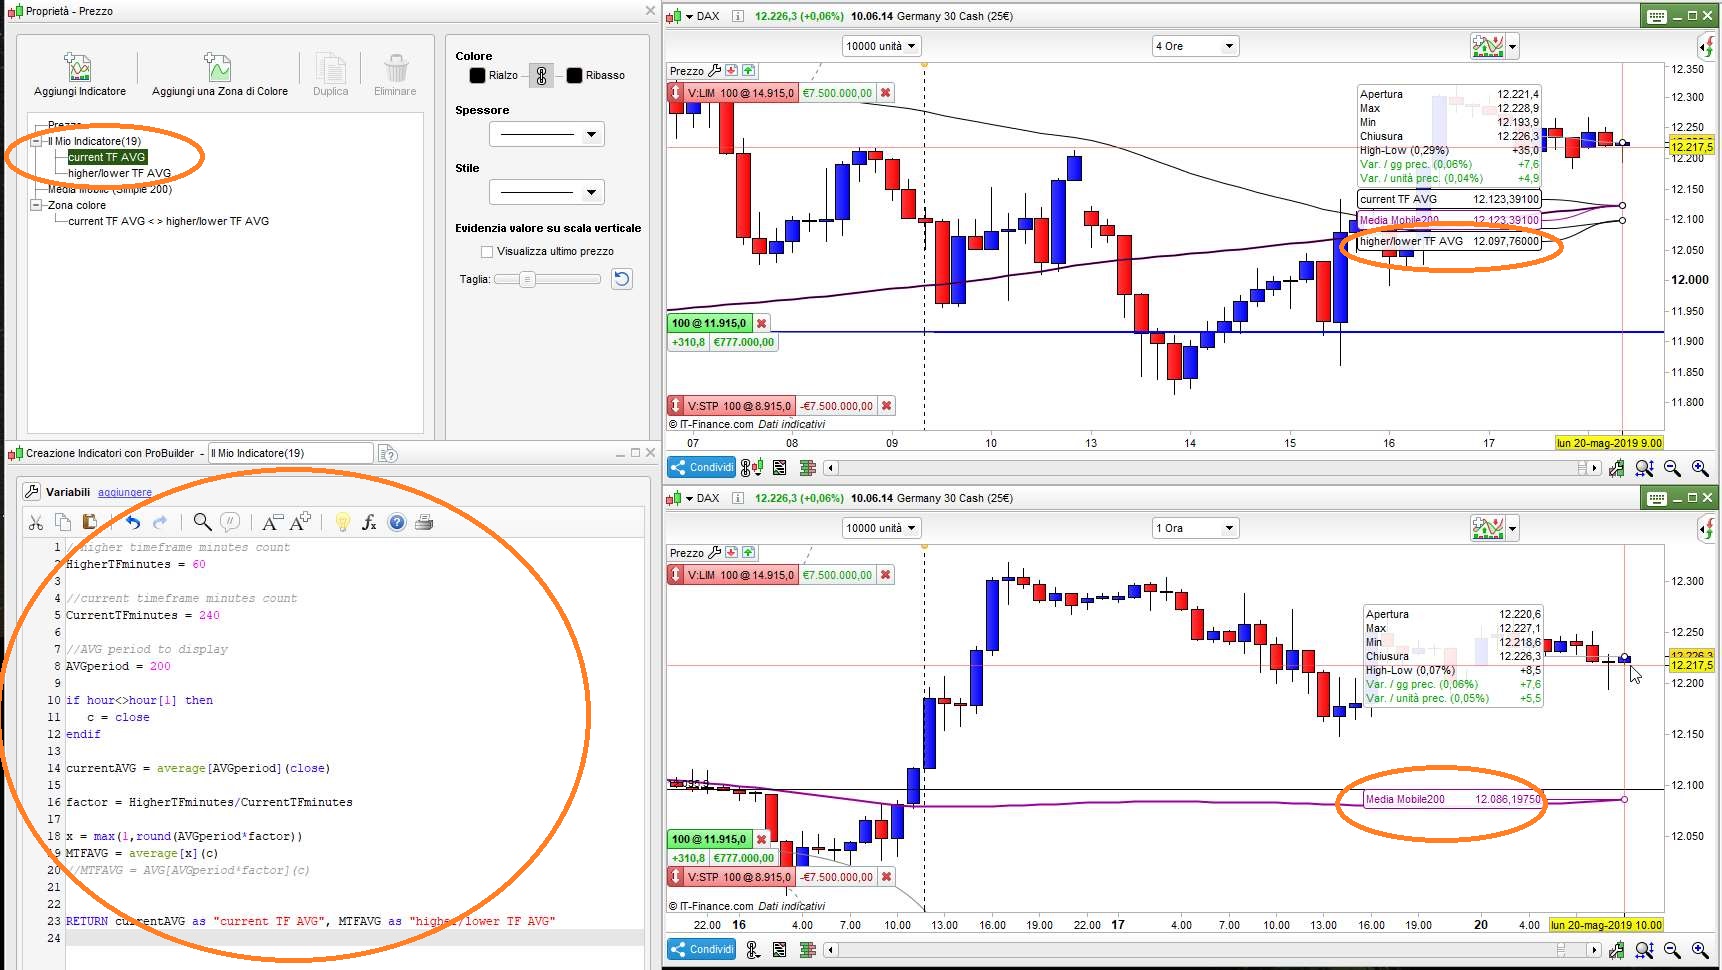
This works (but, as you can see from attached pic, there’s a slight difference):
//higher timeframe minutes count
HigherTFminutes = 60                 //Can be lower (in this case)
//current timeframe minutes count
CurrentTFminutes = 240
//AVG period to display
AVGperiod = 200
if hour<>hour[1] then
   c = close
endif
currentAVG = average[AVGperiod](close)
factor = HigherTFminutes/CurrentTFminutes
x = max(1,round(AVGperiod*factor))
MTFAVG = average[x](c)
RETURN currentAVG as "current TF AVG", MTFAVG as "higher/lower TF AVG"
there’s a slight difference
Mainly the fact that one is a 200 period average on the hourly chart and the other is a 50 period average on the four hour chart!
75% of the data required to truly calculate a 200 period hourly average is not available on the four hour chart.
Thank you very much Roberto!
Yes I have been trying and it works ok but the data is slightly different, I is ok to use in demo but not in a real account.
I guess this is the most accurate that we can actually have.
Thanks in advance for yor help