Improving the indicator Intraday DAX Trend
Forums › ProRealTime English forum › ProBuilder support › Improving the indicator Intraday DAX Trend
- This topic has 4 replies, 2 voices, and was last updated 8 years ago by
Nicolas.
-
-
08/30/2016 at 10:24 AM #12457
Hi all.
I am trying to improve the strategy of “Day-trading the DAX with the Trend” (http://www.prorealcode.com/prorealtime-trading-strategies/day-trading-dax-trend/), and built an indicator to see the profits per candle on every trade, and think on the possible changes on this strategy. I found a solution including the Elder Impulse System, operating if it is green or red (depending if it should be long or short), on the timeframe of 1 hour, starting on 8:00 and ending on 21.00 hours. It seems that normally the most profitable candles are between 9:00 and 11:00, but on the paper this indicator can be used between 8:00 and 21:00 hours with minimized losses.
This strategy will work probably well with manual trading (I still did not tried it). But I want to do it automatically, and I think that I will see there some problems:
- The indicator Elder Impulse System (EIS) does not give immediately the green or red signal on the start of the candle, but it waits to calculate it some time later. That’s also the reason because I choosed the 1H timeframe, because for example with 1min the indicator can change many times in 1 minute. So, If I do the Proorder with this strategy, it will probably not start on 8:00 o’clock, as the program will wait to calculate the datas, and will wait to the next candle, which will be of course too late. With 1H timeframe the indication is much stable, but it does not start immediately on the start of the candle. And this situation will be exactly the same on each candle.
- There will be many starts and stops of the tradings in the whole day, but this should be no problem if this strategy could work exactly as on the graphic.
- The variable “m” is the number of periods of the moving average. I could test that it works good with 150-200, but normally works better with lower values like 22. But in this case, sometimes the candle starts long below this level, and during the candle gets over it, so that I will have exactly the same problem than in point 1.
I tried to substitute the EIS indicator by the RSI, giving the long or short signals if the value is higher or lower than 50. It is better than the Trend indicator itself, but not so good as these with EIS, having some losses on some candles (but total positive day profits). This strategy should be easier to work because on the start of the candles, the RSI level (normally) is already defined.
So, what are your feelings about this strategy?
Thanks in advance for all your suggestions!
12345678910111213141516171819202122232425262728293031323334353637383940414243444546474849505152535455565758596061626364656667686970717273//INDICATORSMM=Average[m](close)iMACD=MACD[12,26,9](close)ca1=close>MMca2=iMACD>0cv1=close<MMcv2=iMACD<0IF time>080000 THENstime=1ELSEstime=0ENDIF//****************************rem >> Elder Impulse System <<r=13MACDhHoy = MACD[12,26,9](close)[0]MACDhAyer = MACD[12,26,9](close)[1]MediaHoy= ExponentialAverage[r](close)[0]MediaAyer= ExponentialAverage[r](close)[1]if (MACDhHoy > MACDhAyer) thenMomento = 0.5elseMomento = -0.5endifif (MediaHoy > MediaAyer) thenTendencia = 0.5elseTendencia = -0.5endifEIS = Momento + TendenciaIF ca1 AND ca2 AND stime AND time<=210000 AND EIS>0 THENposition=1ELSIF cv1 AND cv2 AND stime AND time<=210000 AND EIS<0 THENposition=-1ELSEposition=0ENDIFIF position=1 THENpl=close-openELSIF position=-1 THENpl=open-closeELSEpl=0ENDIFbb=intradaybarindexIF bb>100 THENcc=144ELSIF bb>16 THENcc=24ELSIF bb>6 THENcc=12ELSEcc=3ENDIFaa=summation[cc](pl)//3 para 4H, 12 para 1H, 24 para 30 minIF stime AND time<=210000 THENaa=aaELSEaa=0ENDIFva=low-openvb=open-highIF open<close THEN//vela alcistasl=vaELSIF open>close THEN//vela bajistasl=vbENDIFreturn pl AS "Profit-Loss", aa AS "Beneficio acumulado", sl AS "Stop Loss", 0 AS "Zero"08/30/2016 at 3:11 PM #12465Hi Petrus, I tried your indicator and read your post but I still don’t have well understood how to use it and how to help you. Maybe you could help catch the interest of my old brain with screenshots of your request : what do you expect from the indicator as a long or sell signal, etc.. Thanks!
08/30/2016 at 6:55 PM #12486Hi Nicolas.
I can bet that my brain is much older than yours!! So, the winner will have to pay the first 10 beers (or wines) on the next face to face. I’m 67 years old, so that I think that you have no chances!
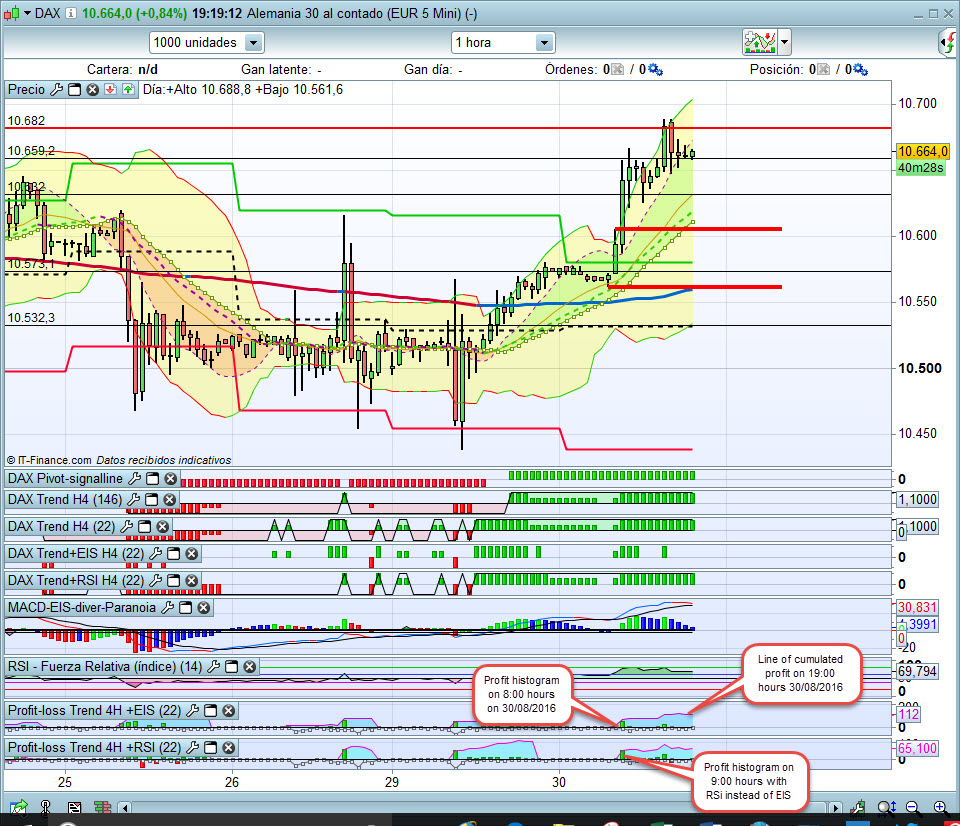
The intention of this indicator is to give me the profit/loss values of each candle Starting on 8:00 hours, and the cumulated value on the end of the day (21:00 hours), in order to think to change the parameters or not to get the maximum profit each day. I normally configure the Profit-loss value as histogram, and the “Beneficio acumulado” (Cumulated intraday profit) as a line (you can see them on the photo hereby).
And my problem is that the EIS indicator will switch for example from 0 to 1 (green) on 8:16 hours (this is only an example), and not in the switching between 7:59 and 8:00, so that the start of the automatic trading will wait to the next candle (9:00), and this is too late.
I know that I’m not very good explaining the problem, so that if you need more explanations, please contact me again.
Photo will be send on the next post.
Best regards and many thanks for your helps everywhere!
08/30/2016 at 6:58 PM #1248708/30/2016 at 7:37 PM #12497 -
AuthorPosts
Find exclusive trading pro-tools on 
