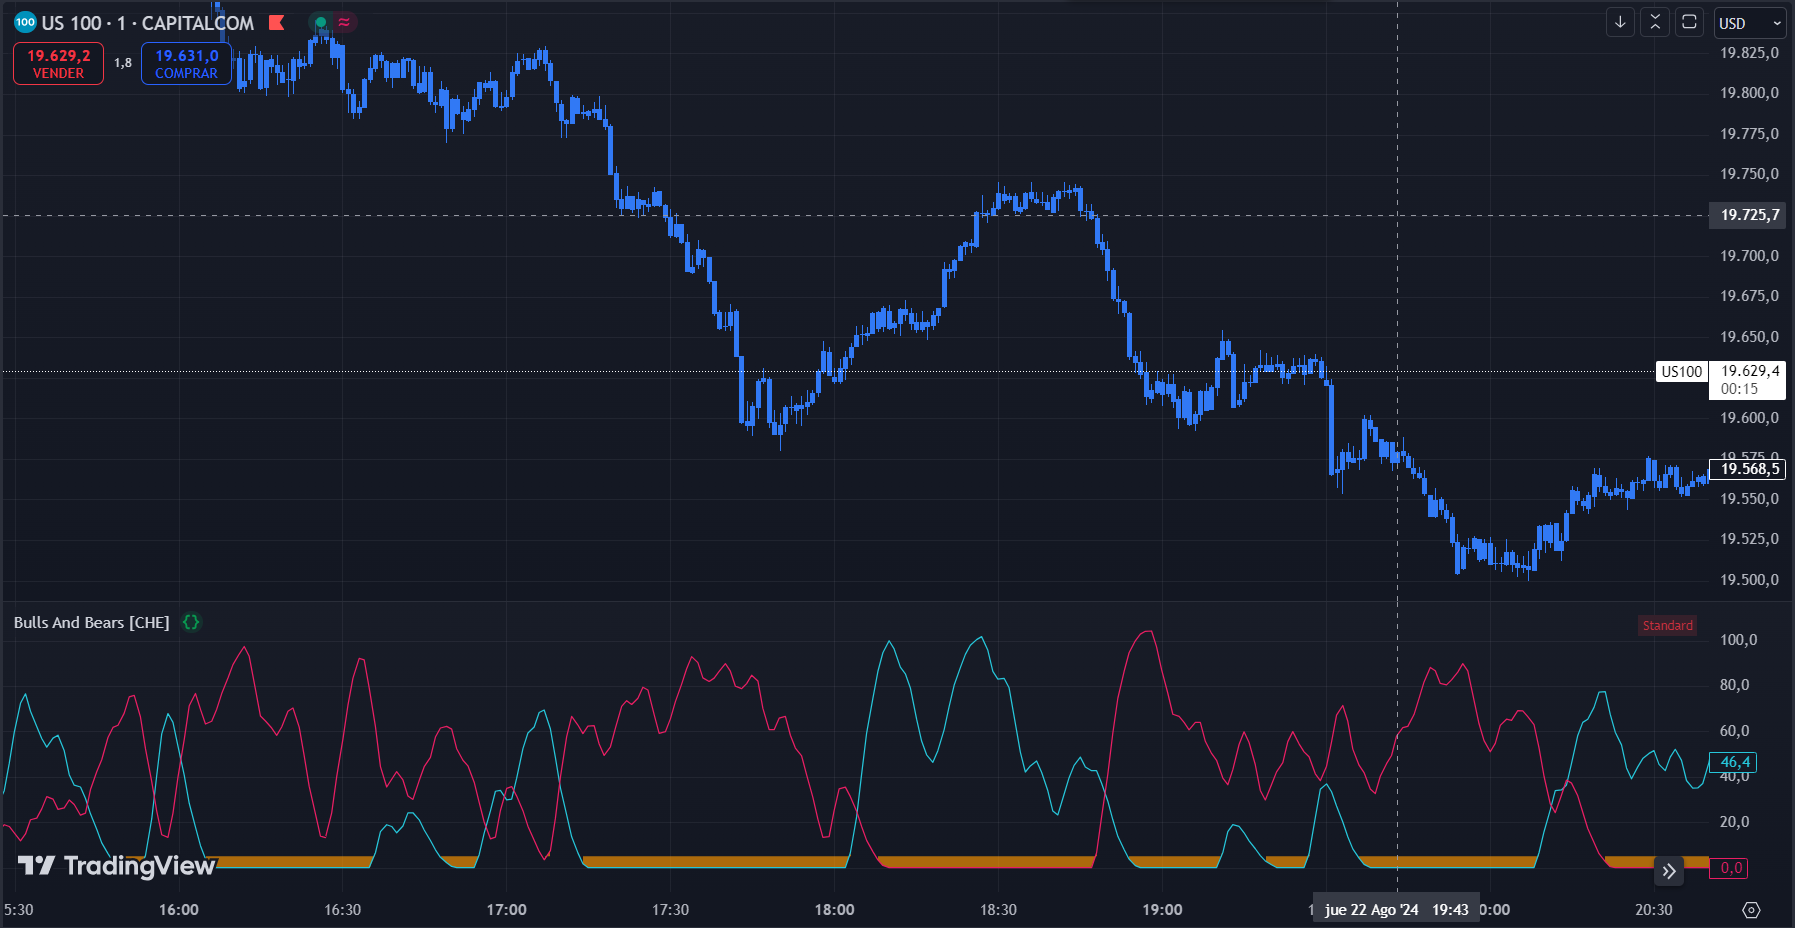
INDICADOR BULLS and BEARS TRADINGVIEW

Viewing 3 posts - 1 through 3 (of 3 total)
  • Author
    Posts
  • #236633 quote
    deletedaccount22102025
    Participant
    New

    Hola todos, me podéis ayudar a transcribir el siguiente indicador de Tradingview llamado Bulls and Bears. Gracias

    https://es.tradingview.com/v/m3V9AJfi/


    //@version=5
    indicator(“Bulls And Bears [CHE]”, overlay=false)
    //
    _display_switch_input = input.string(“Standard”, “Display”, group=”Select Display”, options=[“Standard”, “Bar”, “Oscillator”, “Standard plus signals”])
    // Assign values to the input based on the selected option
    _display_switch = _display_switch_input == ‘Standard’? 1:
     _display_switch_input == ‘Bar’? 2:
     _display_switch_input == ‘Oscillator’? 3:
     _display_switch_input == ‘Standard plus signals’? 4:1
    // Calculate maximum and minimum values
    highest = math.max(high, open, close, low)
    lowest = math.min(high, open, close, low)
    src = (highest – lowest) / 2 + lowest
    // Relative Strength Index (RSI) condition
    rsi_condition = ta.rsi(close, 14) > 50
    // Bullish and Bearish conditions
    bullish_condition = src > src[1] and rsi_condition ? 100 : 0
    bearish_condition = src < src[1] and not rsi_condition ? 100 : 0
    // Super Smoother function
    super_smoother(src, length) =>
        freq = (1.414 * math.pi) / length
        a = math.exp(-freq)
        c2 = 2 * a * math.cos(freq)
        c3 = -a * a
        c1 = 1 – c2 – c3
        smooth = 0.0
        smooth := c1 * (src + src[1]) * 0.5 + c2 * nz(smooth[1]) + c3 * nz(smooth[2])
        smooth
    // Input for length difference
    length_difference = input.int(16, title=”Length Difference”, group = “Smoothing” )
    lim = input.int(5, title=”Length threshold”, group = “Graphic”)
    // Calculate super smooth moving averages for bullish and bearish conditions
    ma_bullish = super_smoother(bullish_condition, length_difference)
    if ma_bullish < 0.2
        ma_bullish := 0
    ma_bearish = super_smoother(bearish_condition, length_difference)
    if ma_bearish < 0.2
        ma_bearish := 0
    // _display_switch==1 Standard
    // Plot the super smooth moving averages
    plot_bullish = plot(_display_switch==1 or _display_switch==4?ma_bullish:na, “”, color=color.rgb(0, 255, 51))
    plot_bearish = plot(_display_switch==1 or _display_switch==4?ma_bearish:na, “”, color=color.rgb(255, 0, 0))
    // Plot to enable filling
    plot_lim=plot(_display_switch==1 or _display_switch==4?lim:na, display=display.none, editable=false)
    // Fill the areas based on conditions
    fill(plot_lim, plot_bullish, color=ma_bullish[1] < lim and _display_switch ? color.rgb(0, 255, 51, 50) : na)
    fill(plot_lim, plot_bearish, color=ma_bearish[1] < lim and _display_switch ? color.rgb(255, 0, 0, 50) : na)
    // _display_switch == Bar
    plot(_display_switch==2?bullish_condition:na,”Columns”,color=color.rgb(0, 255, 51), style=plot.style_columns)
    plot(_display_switch==2?bearish_condition:na,”Columns”,color=color.rgb(255, 0, 0), style=plot.style_columns)
    // _display_switch == Oscillator
    // Bullish and Bearish conditions
    bullish_bearish = src > src[1] and rsi_condition ? 100 : src < src[1] and not rsi_condition ? -100 : 0
    ma_oscillator = super_smoother(bullish_bearish, length_difference)
    plot(_display_switch==3?ma_oscillator:na,”Oscillator”, color=ma_oscillator>=0?color.rgb(0, 255, 51):color.rgb(255, 0, 0))
    midline = hline(0, “Middle Band”, _display_switch==3?color.new(#787B86, 50):na)
    // Add some useful Buy and Sell Signal
    //Custom ADX and RSI Strategy
    // User inputs
    len3 = input(9, “Length ADX”, group = “ADX Setting”)
    th = input(30, “Threshold”, group = “ADX Setting”)
    signal_th = input.float(5, minval=0, maxval=5, step=0.2, group = “Signal Threshold”)
    // Calculate True Range (TR)
    TR = math.max(math.max(high – low, math.abs(high – nz(close[1]))), math.abs(low – nz(close[1])))
    // Calculate Directional Movement (DMP and DMM)
    DMP = high – nz(high[1]) > nz(low[1]) – low ? math.max(high – nz(high[1]), 0) : 0
    DMM = nz(low[1]) – low > high – nz(high[1]) ? math.max(nz(low[1]) – low, 0) : 0
    // Initialize variables for Smoothed True Range (STR), Smoothed DMP (SDMP), and Smoothed DMM (SDMM)
    var float STR = na
    var float SDMP = na
    var float SDMM = na
    // Calculate smoothed values
    STR := nz(STR[1]) – (nz(STR[1]) / len3) + TR
    SDMP := nz(SDMP[1]) – (nz(SDMP[1]) / len3) + DMP
    SDMM := nz(SDMM[1]) – (nz(SDMM[1]) / len3) + DMM
    // Calculate DI+ and DI-
    DIPlus = SDMP / STR * 100
    DIMinus = SDMM / STR * 100
    // Calculate DX and Zero-lag ADX (ZADX)
    DX = math.abs(DIPlus – DIMinus) / (DIPlus + DIMinus) * 100
    Lag = (len3 – 1) / 2
    ZADX = ta.hma(DX + (DX – DX[Lag]), len3)
    if ZADX < 0
        ZADX := 0
    // RSI calculation settings
    rsiLengthInput = input.int(3, minval=1, title=”RSI Length”, group=”RSI Settings”)
    rsiSourceInput = input.source(close, “Source”, group=”RSI Settings”)
    // Calculate RSI
    up = ta.rma(math.max(ta.change(rsiSourceInput), 0), rsiLengthInput)
    down = ta.rma(-math.min(ta.change(rsiSourceInput), 0), rsiLengthInput)
    rsi = down == 0 ? 100 : up == 0 ? 0 : 100 – (100 / (1 + up / down))
    // Buy and sell conditions
    sell = ZADX > th and rsi[2] > 80 and ma_bearish <= signal_th and _display_switch==4
    buy = ZADX > th and rsi[2] < 25 and ma_bullish <= signal_th and _display_switch==4
    // Plot buy and sell signals
    plotshape(buy and not buy[1]  ? lim : na, title=”Buy”, location=location.absolute, style=shape.circle, size=size.tiny, color=color.green)
    plotshape(sell and not sell[1]? lim : na, title=”Sell”, location=location.absolute, style=shape.circle, size=size.tiny, color=color.red)
    //—-
    bool disclaimer = input(false, ‘Hide Disclaimer’, group = “Disclaimer”)
    var tb = table.new(position.top_right, 1, 1
      , bgcolor = #35202b)
    if barstate.isfirst and not disclaimer
        table.cell(tb, 0, 0, _display_switch_input
          , text_size = size.small
          , text_color = #cc2f3c)

    Captura-de-pantalla-2024-08-23-113000.png Captura-de-pantalla-2024-08-23-113000.png
    #236895 quote
    Iván González
    Moderator
    Legend

    Buenas. Aquí tienes el indicador.

    //--------------------------------------------------------------------//
    //PRC_Bulls and Bears
    //version = 0
    //30.08.24
    //Iván González @ www.prorealcode.com
    //Sharing ProRealTime knowledge
    //--------------------------------------------------------------------//
    //-----Inputs---------------------------------------------------------//
    //--------------------------------------------------------------------//
    lengthDifference=16 //Length Difference
    lim=5 //Length threshold
    //---Strategy ADX and RSI inputs
    len3=9 //Length ADX
    th=30 //Thresold ADX
    SignalTh=5 //Signal Threshold (decimal 0-5)
    rsiLenghtInput=3
    rsiSourceInput=close
    PlotSignals=0
    //--------------------------------------------------------------------//
    //-----Calculate maximun and minimum values---------------------------//
    //--------------------------------------------------------------------//
    maximum=high
    minimum=low
    src=(maximum-minimum)/2+minimum
    //--------------------------------------------------------------------//
    //-----RSI condition--------------------------------------------------//
    //--------------------------------------------------------------------//
    rsiCondition=rsi[14](close)>50
    //--------------------------------------------------------------------//
    //-----Bullish and Bearish conditions---------------------------------//
    //--------------------------------------------------------------------//
    bullishCondition=(src>src[1] and rsiCondition)*100
    bearishCondition=(src<src[1] and not rsiCondition)*100
    //--------------------------------------------------------------------//
    //-----Calculate Super Smooth Moving averages-------------------------//
    //--------------------------------------------------------------------//
    //---Bullish MA
    freqbull=(1.414*3.14159)/lengthDifference
    abull=exp(-freqbull)
    c2bull=2*abull*cos(180/3.14159*freqbull)
    c3bull=-abull*abull
    c1bull=1-c2bull-c3bull
    if barindex>1 then
    MABullish=c1bull*(bullishCondition+bullishCondition[1])*0.5+c2bull*MABullish[1]+c3bull*MABullish[2]
    else
    MABullish=0
    endif
    if MABullish < 0.2 then
    MABullish = 0
    endif
    //---Bearish MA
    freqbear=(1.414*3.14159)/lengthDifference
    abear=exp(-freqbear)
    c2bear=2*abear*cos(180/3.14159*freqbear)
    c3bear=-abear*abear
    c1bear=1-c2bear-c3bear
    if barindex>1 then
    MABearish=c1bear*(bearishCondition+bearishCondition[1])*0.5+c2bear*MABearish[1]+c3bear*MABearish[2]
    else
    MABearish=0
    endif
    if MABearish < 0.2 then
    MABearish = 0
    endif
    //--------------------------------------------------------------------//
    //-----ADX and RSI strategy-------------------------------------------//
    //--------------------------------------------------------------------//
    //---Calculate True Range
    TRa=max(max(high-low,abs(high-close[1])),abs(low-close[1]))
    //---Calculate Directional Movement
    if (high-high[1])>(low[1]-low) then
    DMP=max(high-high[1],0)
    else
    DMP=0
    endif
    if (low[1]-low)>(high-high[1]) then
    DMM=max(low[1]-low,0)
    else
    DMM=0
    endif
    //---Calculate Smoothed values
    if barindex>1 then
    STR=STR[1]-(STR[1]/len3)+TRa
    SDMP=SDMP[1]-(SDMP[1]/len3)+DMP
    SDMM=SDMM[1]-(SDMM[1]/len3)+DMM
    endif
    //---Calculate DI+ and DI-
    DIP=SDMP/STR*100
    DIM=SDMM/STR*100
    //---Calculate DX and Zero-lag ADX
    DX=abs(DIP-DIM)/(DIP+DIM)*100
    lag=(len3-1)/2
    ZADX=hullaverage[len3](DX+(DX-DX[lag]))
    if ZADX<0 then
    ZADX=0
    endif
    //---RSI Calculation
    myRSI=rsi[rsiLenghtInput](rsiSourceInput)
    //---Buy and Sell Signals
    sellSignal=ZADX>th and myRSI[2]>80 and MABearish<=signalTh
    buySignal=ZADX>th and myRSI[2]<25 and MABullish<=signalTh
    //---Plot signals
    if PlotSignals and sellSignal and not sellSignal[1] then
    drawpoint(barindex,lim,2)coloured("red")
    elsif PlotSignals and buySignal and not buySignal[1] then
    drawpoint(barindex,lim,2)coloured("green")
    endif
    //--------------------------------------------------------------------//
    return MABullish style(line,2)coloured(0,255,51), MABearish style(line,2) coloured(255,0,0), lim coloured("grey",5)
    thanked this post
    #236897 quote
    deletedaccount22102025
    Participant
    New

    Muchas gracias Iván. Excelente trabajo como siempre…..yo sigo deseando que publiques tu artillería pesada de indicadores personales…..jajjaja. Muchas gracias de nuevo,

Viewing 3 posts - 1 through 3 (of 3 total)
  • You must be logged in to reply to this topic.
ProRealAI ProRealAI New

Stuck on this ProBuilder code?

Describe what this topic is trying to build, in plain English, and ProRealAI writes the ProRealTime™ indicator, screener or system for you.

Available in 7 languages
Try ProRealAI

INDICADOR BULLS and BEARS TRADINGVIEW


ProBuilder: Indicadores y Herramientas

New Reply
Summary

This topic contains 2 replies,
has 2 voices, and was last updated by deletedaccount22102025
2 years ago.

Topic Details
Forum: ProBuilder: Indicadores y Herramientas
Language: Spanish
Started: 08/23/2024
Status: Active
Attachments: 1 files
Logo Logo
Loading...