Hi,
I Have looked around for an indicator, but can´t find it anywhere.
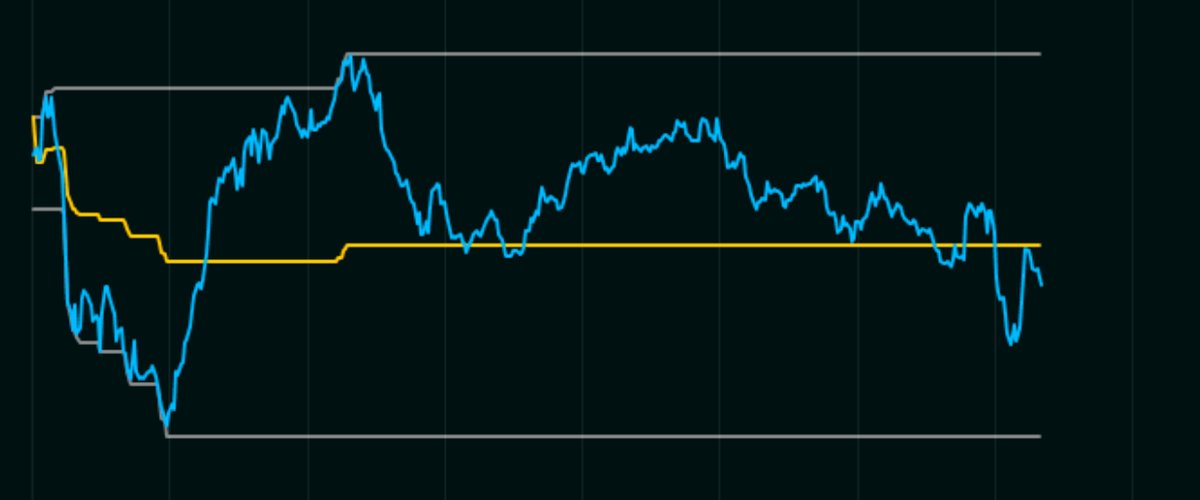
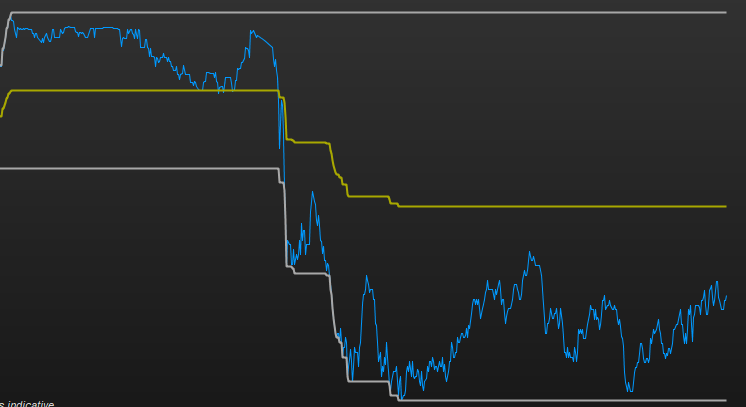
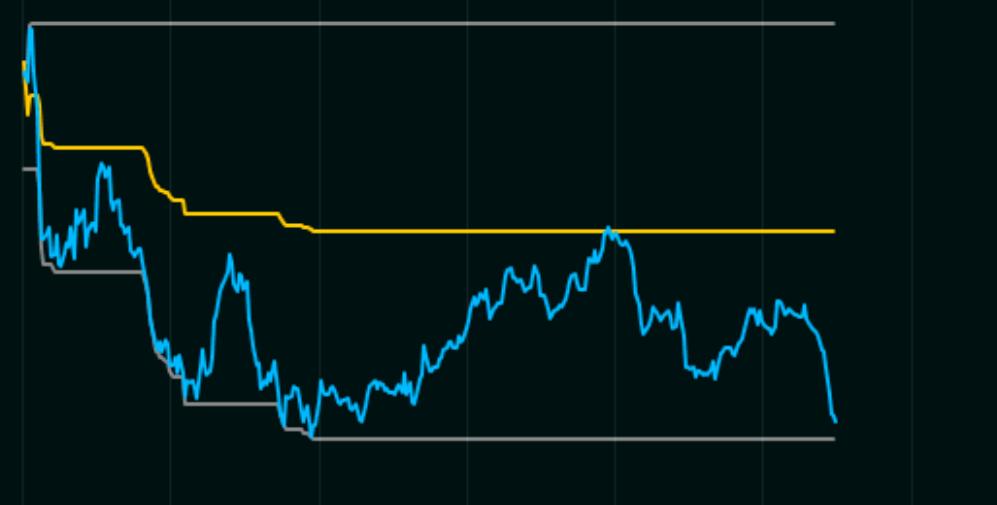
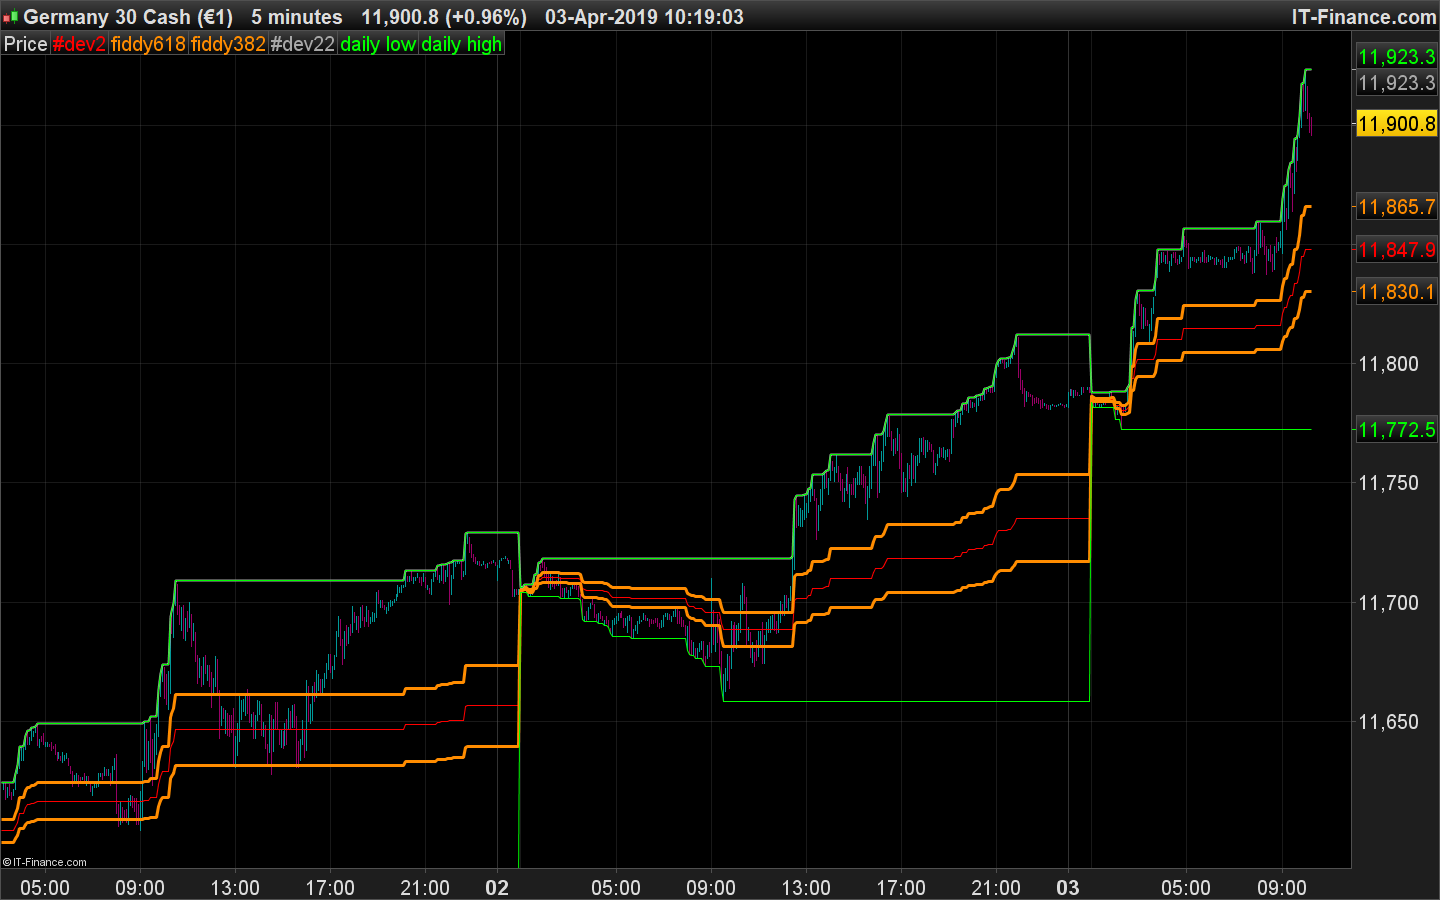
The parameters are ATR2 Daily/2 + Daily Low (It shold look like the Picture, I Think the parameters make the yellow line and the grey lines are following low and high)
Can somone help me make this indicator? I don´t have the knowledge or skill to do it myself, and belive me I’v tried
Thanks
Welcome to the forums.
There are some basic rules that should be followed when posting in the forums. Please use a topic title that is meaningful and describes your question or subject. Also please ensure that you post in the correct forum. Your question is indicator related and so should be in the ProBuilder forum and not the Platform Support forum which is for platform issues. Posting in the correct forum means that you are most likely to find an answer or receive replies to your topic.
I have moved your topic and given it a new topic title. 🙂
I don’t think that this indicator has something to deal with ATR. The grey lines are made of daily high/low and the yellow one is just the average of them (the middle):
htr = Dlow(0)
ltr = Dhigh(0)

idtr = (htr+ltr)/2

return htr coloured(168,168,168) style(line,2),ltr coloured(168,168,168) style(line,2),idtr coloured(168,168,0) style(line,2)
Thank you Nicolas, Amazing!
Hi Nicolas,
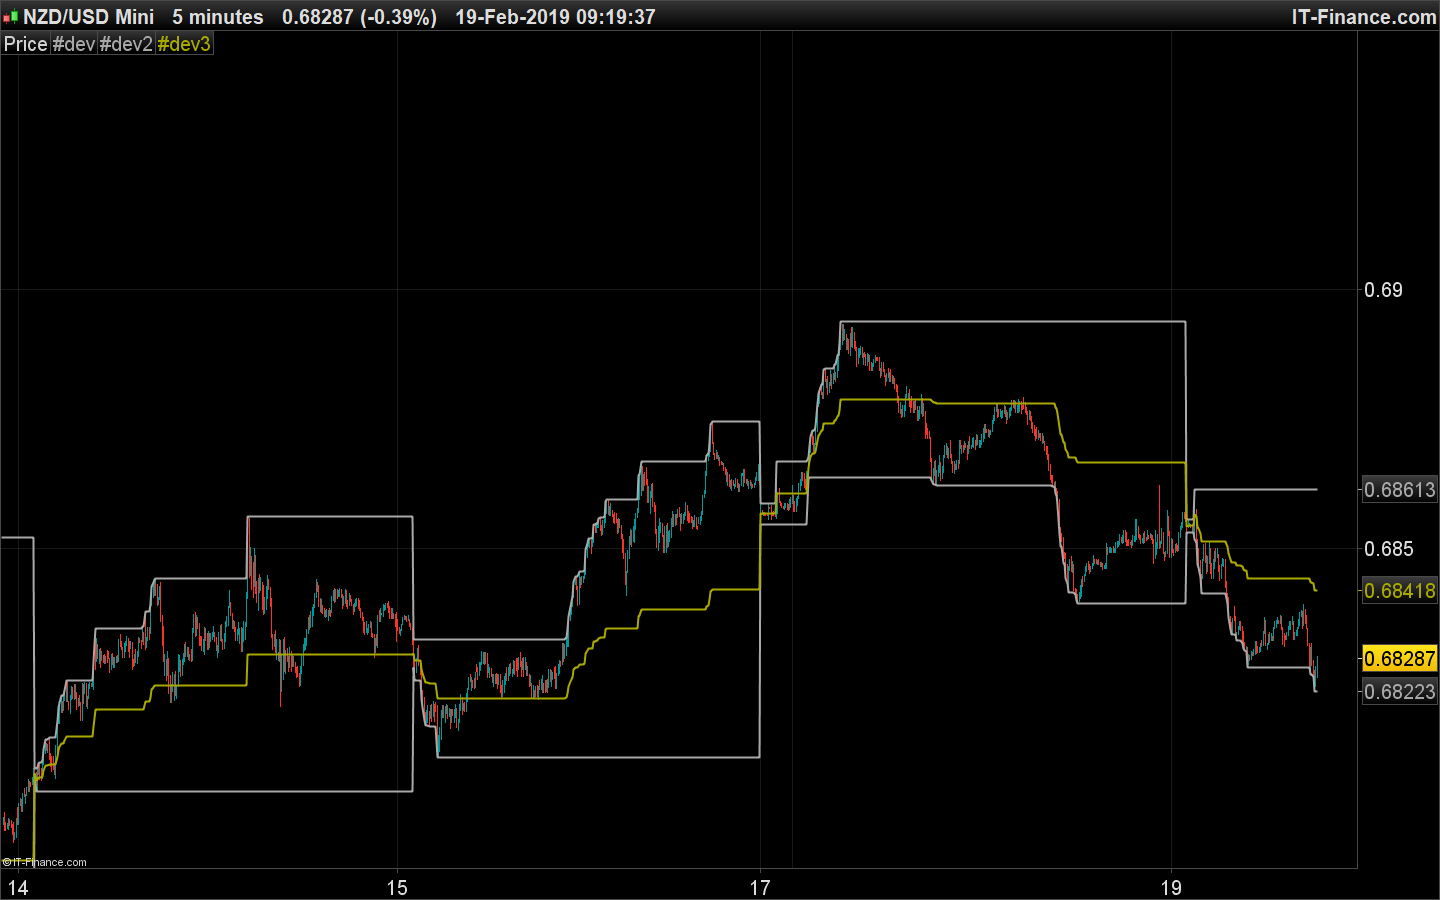
I belive ATR2 Daily have to include. First Picture is the indicator you helped me with. Second one is how it should look like. You see the price is up and touching the yellow line. I tried to change the code on my own but didn’t succed.
I tried with:
htr = Dlow(0)
ltr = Dhigh(0)
atr = Averagetruerange

idtr = (atr[2])/2+htr

return htr coloured(168,168,168) style(line,2),ltr coloured(168,168,168) style(line,2),idtr coloured(168,168,0) style(line,2)
But it didn’t work
You can try with the below code, but I don’t think it is correct IMO. Even by dividing the daily ATR by 2, the lowest level+ATR/2 sometimes exceed the highest one …
Do you have more useful information about the program? It would save us times! 🙂
htr = Dlow(0)
ltr = Dhigh(0)

ATRperiod=2
dTR = 0
for i = 0 to ATRperiod-1
dTR=dTR+max(abs(Dhigh(i)-Dlow(i)),max(abs(Dhigh(i)-Dclose(i+1)),abs(Dlow(i)-Dclose(i+1))))
next

avg = dTR/ATRperiod


idtr = (avg/2)+htr

return htr coloured(168,168,168) style(line,2),ltr coloured(168,168,168) style(line,2),idtr coloured(168,168,0) style(line,2)
Thank you Nicolas, pretty funny. It got closer. The yellow line is now in the middle of the yellow lines in the Pictures above. I’m sorry, I don’t have any more information about the indicator. But as you can see, it’s pretty accurat
In your screenshot, the daily high is not the same as mine, so I guess the first solution I gave should work (mid high/low). I think of a different time zone.
Hello,
I just received this from a friendly soul on twitter. This works on tradingview, only intraday because of the time parameter.
Maybe this can help Nicolas?
//
=3 study(“Fiddy”, overlay=true)
t = time(“1440”, session.extended) // 1440=60*24 is the number of minutes in a whole day. You may use “0930-1600” as second session parameter
//plot(t, style=linebr) // debug is_first = na(t[1]) and not na(t) or t[1] < t
//plotshape(is_first, color=red, style=shape.arrowdown)
day_high = na day_low = na
if is_first and barstate.isnew
day_high := high
day_low := low
else day_high := day_high[1]
day_low := day_low[1]
fiddy (ATR2 daily /2)= (max(day_high, close[1]) + min(day_low, close[1]))/2
fiddy2 = (max(day_high, close[1]) – min(day_low, close[1]))*0.618 + day_low
fiddy3 = (max(day_high, close[1]) – min(day_low, close[1]))*0.382 + day_low
if high > day_high day_high := high
if low < day_low day_low := low
plot(fiddy, color=red, title=”fiddy”)
plot(fiddy2, color=orange, title=”fiddy618″)
plot(fiddy3, color=orange, title=”fiddy382″)
plot(day_high, color=lime, title=”day_high”)
plot(day_low, color=lime, title= ‘day_low’)
You can remove the lines below if you only want “Fiddy”
fiddy2 = (max(day_high, close[1]) – min(day_low, close[1]))*0.618 + day_low
fiddy3 = (max(day_high, close[1]) – min(day_low, close[1]))*0.382 + day_low
@MonopolyTm
>> Please update your country flag in your profile. Thank you 🙂 <<
Is the code you submit related to this original topic in some way?
Done!
Yes, this is the indicator that HARO is asking about. Just that the code is for tradingview and there is a few more added lines for confirmation (61% & 38%).
// mono
Ok, here is the translation of this tradingview code into ProRealTime coding language:
htr = Dhigh(0)
ltr = Dlow(0)

fiddy = (max(dhigh(0), dclose(1)) + min(dlow(0), dclose(1)))/2
fiddy2 = (max(dhigh(0), dclose(1)) - min(dlow(0), dclose(1)))*0.618 + dlow(0)
fiddy3 = (max(dhigh(0), dclose(1)) - min(dlow(0), dclose(1)))*0.382 + dlow(0)

return fiddy coloured(255,0,0), fiddy2 coloured(255,140,0) as "fiddy618",fiddy3 coloured(255,140,0) as "fiddy382",htr coloured(168,168,168) style(line,2),ltr coloured(0,255,0) style(line) as "daily low", htr coloured(0,255,0) style(line) as "daily high"
My man! Thank you Nicolas!