Hello, with Nicolas’s help the following initial code was generated to draw trend lines.
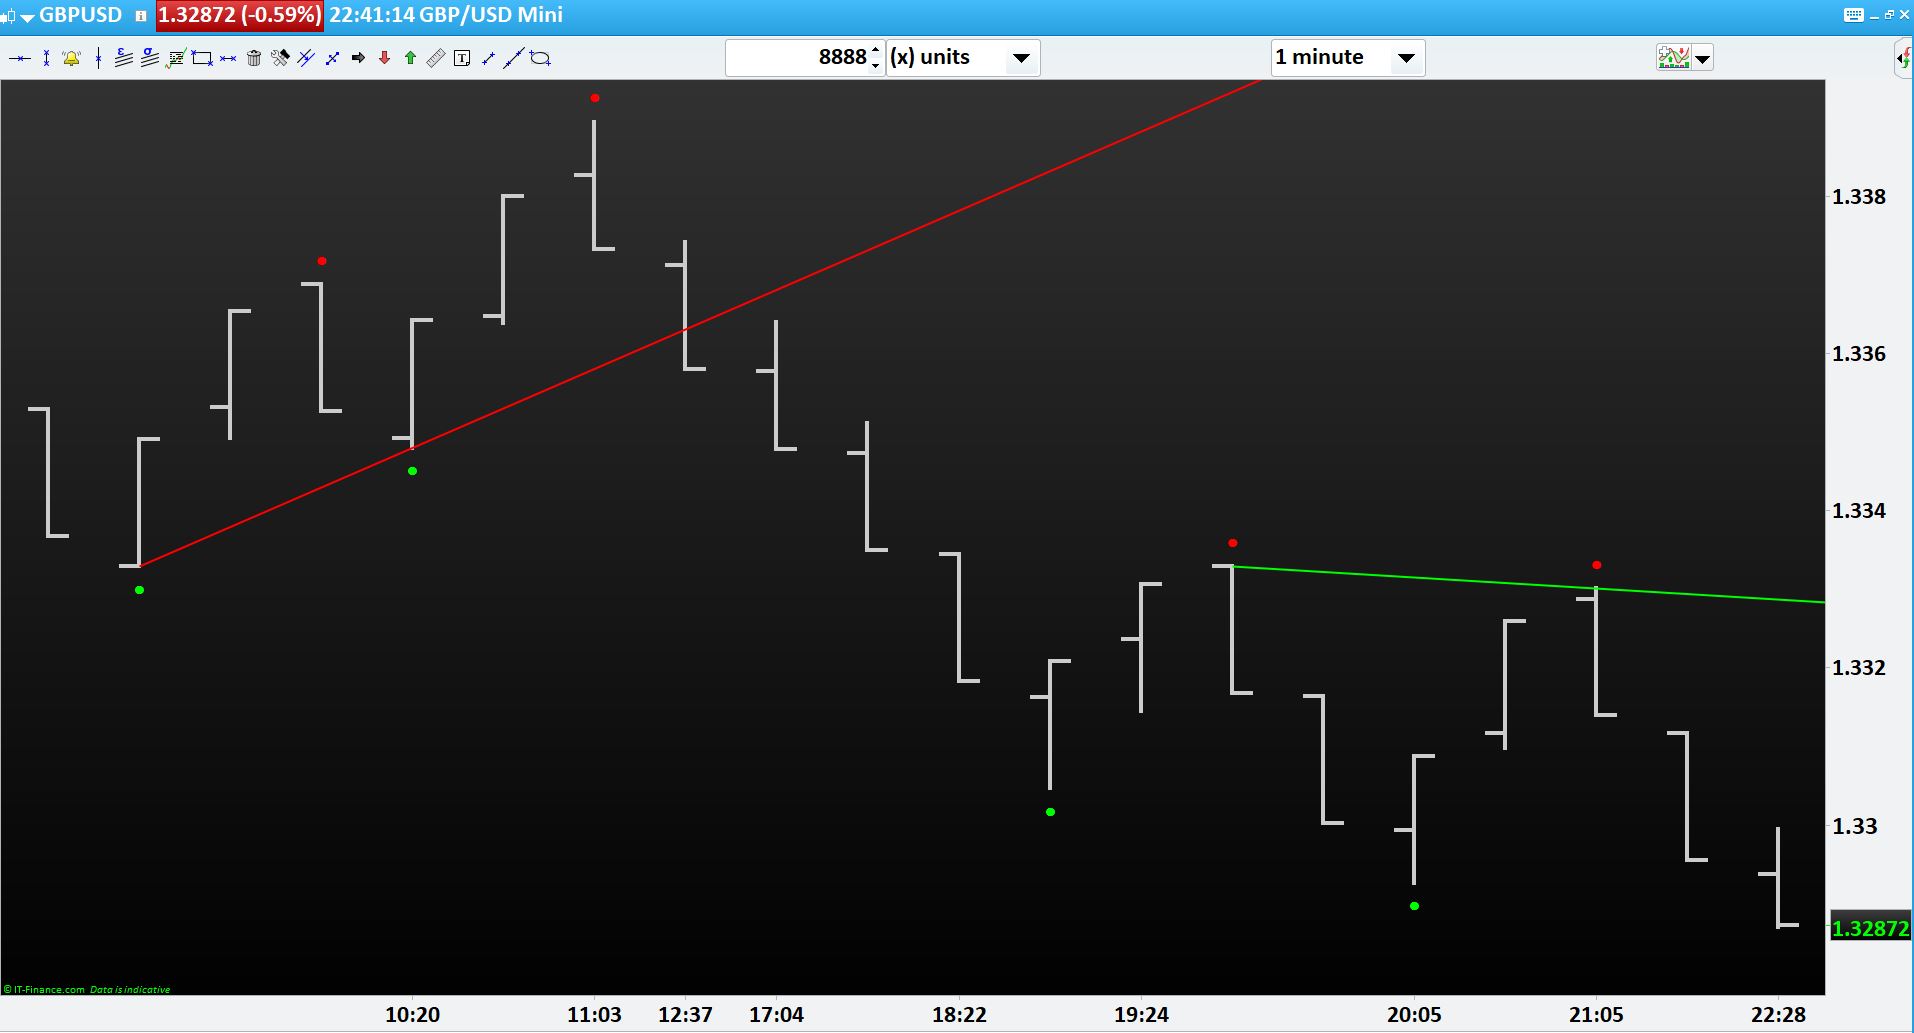
Now, I want it to draw only 2 trend lines in the chart- one up trend line joining the last 2 swing lows (2nd swing low must be higher than 1st swing low) and one down trend line joining the last 2 swing highs (2nd swing high must be lower than 1st swing high) as shown in the chart.
Can any one help me on this please.
Regards,
//VARIABLES
//x 255 y 0 z 0 , u 0 v 255 w0
// ----------------------

H2=high[2]
H1=HIGH[1]
H0=HIGH[0]
L2=LOW[2]
L1=LOW[1]
L0=LOW[0]

// Swing High and Swing Low separation
iF h1>=h2 AND h1>h0 THEN
T=-3
else
t=0
endif
IF l1<=l2 AND l1<l0 THEN
T1=3
ELSE
T1=0
ENDIF

// Swing High
if t=-3 AND T1=0 then
sh=h1
ELSif t=-3 AND T1=3 then
sh=h1
ELSE
SH=0
ENDIF

// Swing Low
If t1=3 AND T=0 then
sl=l1
elsif t1=3 AND T=-3 then
sl=l1
else
sl=0
endif

//Down trend segment/ line
iF SH=h1 THEN
drawtext("●",barindex[1],sh,dialog,bold,2) coloured(u,v,w)
lastbar=1
//IF TIME>ST AND TIME<ET and date=today  THEN
lasthtt = htt
lasthttbar = httbar
htt=H1
httbar = barindex[1]

if lasthttbar <> lasthttbar[1]  and lastbar[1]=-1 then
//IF TIME>ST AND TIME<ET and date=today THEN
IF htt<Htt[1] then//and ltt<htt and ltt<htt[1] THEN
DRAWLINE(lasthttbar,lasthtt,httbar,htt) COLOURED(X,Y,Z)//(205,0,0)
endif
ENDIF
endif
//ENDIF ENDIF

//Up trend segment/ line
iF SL=l1 THEN
drawtext("●",barindex[1],sl,dialog,bold,2) coloured(x,y,z)
lastbar=-1
//IF TIME>ST AND TIME<ET and date=today THEN
lastltt = ltt
lastlttbar = lttbar
ltt=L1
lttbar = barindex[1]

if lastlttbar <> lastlttbar[1] and lastbar[1]=1 then
//IF TIME>ST AND TIME<ET and date=today THEN
IF Ltt>Ltt[1] then//and htt>ltt and htt>ltt[1] THEN
DRAWLINE(lastlttbar,lastltt,lttbar,ltt) COLOURED(U,V,W)//(0,205,0)
endif
ENDIF
endif
//ENDIF ENDIF
return
Any help to identify the dynamic and latest 2 swing highs/ lows to draw the line would be appreciated.
I think Nicolas, Vonasi and others can help.
If you are using PRT v11 then you can just use my indicator:
Every Fractal trend lines
Thank you Vonasi, however IG Markets are still with PRT v10. And most importantly I want only 2 lines on my chart continuously updating itself based on my dynamic requirement as given earlier and below also:
Trend line joining latest 2 swing highs and latest 2 swing lows to draw the dynamic line
Regards,
I just reread your first post and I see that there is the additional criteria that the most recent swing low is higher than the second most recent and the opposite for swing highs.
In v10 we would need to use loops to search back and find each swing high/low and then exit the loop when we find two that meet our criteria – either that or store a mass of individual variables which is all a bit slow and cumbersome. In v11 everything is much easier with the availability of arrays as we can store every swing high/low that there has ever been in a single variable name. The code would be quite simple except if ever there has not been a lower swing low than the latest one or a higher swing high than the latest one because then we need to check back comparing to the second latest swing high/low and so on and so on. If a market has bottomed out at an all time low and formed a swing high there then we won’t be able to find a lower swing low further back in the data.
v11 also has the ability to draw into the future which v10.3 does not which makes projecting lines forward much easier.
IG are rolling out v11 country by country at the moment so I can’t imagine that it will be long before Australia gets it.
I’m a little bit busy with other things at the moment to get started on a new code and I am only coding in v11 now rather than struggle to achieve things I want in v10.3. Hopefully someone else can help you with v10.3 code or let me know when you get v11 and I will try to find some time to code something.
Many thanks dear Vonasi for your detailed response. Appreciate the same. It seems we need to stay in hope that IG will roll v11 sooner than later. I will let you know then.
Regards,
Yes Vonasi, your understanding is correct, “most recent swing low is higher than the second most recent and the opposite for swing highs”.
Hello Vonasi, Great news. I got the version 11 today and now only. Hence I am requesting you to please help me to draw only 2 trend lines in the chart- one up trend line joining the last 2 swing lows (2nd swing low must be higher than 1st swing low) and one down trend line joining the last 2 swing highs (2nd swing high must be lower than 1st swing high). the line should be extended to the right only.
Can you help me on this please.
Regards,
Here you go:
//parthapersonal Fractals v1.0
//PRT v11
//By Vonasi
//Date: 20201217

defparam drawonlastbaronly = true
//Settings
//BarsBefore = 1
//BarsAfter = 1
//Support = 1
//Resistance = 1
//Points = 1

//Make sure all settings are valid ones
BarsBefore = max(BarsBefore,1)
BarsAfter = max(BarsAfter,1)
StartBack = max(0,startback)

if barindex >= barsbefore + barsafter then

//Look for a low fractal
BarLookBack  = BarsAfter + 1
if low[BarsAfter] < lowest[BarsBefore](low)[BarLookBack] THEN
if low[BarsAfter] = lowest[BarLookBack](low) THEN
a = a + 1
$supportbar[a] = barindex[barsafter]
$supportvalue[a] = low[barsafter]
endif
endif

//Look for a high fractal
if high[BarsAfter] > highest[BarsBefore](high)[BarLookBack] THEN
if high[BarsAfter] = highest[BarLookBack](high) THEN
b = b + 1
$resistancebar[b] = barindex[barsafter]
$resistancevalue[b] = high[barsafter]
endif
endif

if islastbarupdate then
//support line
if a >= 2 then
if support then
zz = 1
for z = a-zz downto 0
if $supportvalue[z] < $supportvalue[z+1] then
drawray($supportbar[z],$supportvalue[z],$supportbar[z+1],$supportvalue[z+1]) coloured(128,0,0)
if points then
drawpoint($supportbar[z],$supportvalue[z],2) coloured(128,0,0)
drawpoint($supportbar[z+1],$supportvalue[z+1],2) coloured(128,0,0)
endif
break
endif
zz = zz + 1
next
endif
endif

//Resistance line
if b >= 2 then
if resistance then
zz = 1
for z = b-zz downto 0
if $resistancevalue[z] > $resistancevalue[z+1] then
drawray($resistancebar[z],$resistancevalue[z],$resistancebar[z+1],$resistancevalue[z+1]) coloured(0,128,0)
if points then
drawpoint($resistancebar[z],$resistancevalue[z],2) coloured(0,128,0)
drawpoint($resistancebar[z+1],$resistancevalue[z+1],2) coloured(0,128,0)
endif
break
endif
zz = zz + 1
next
endif
endif

endif
endif

return
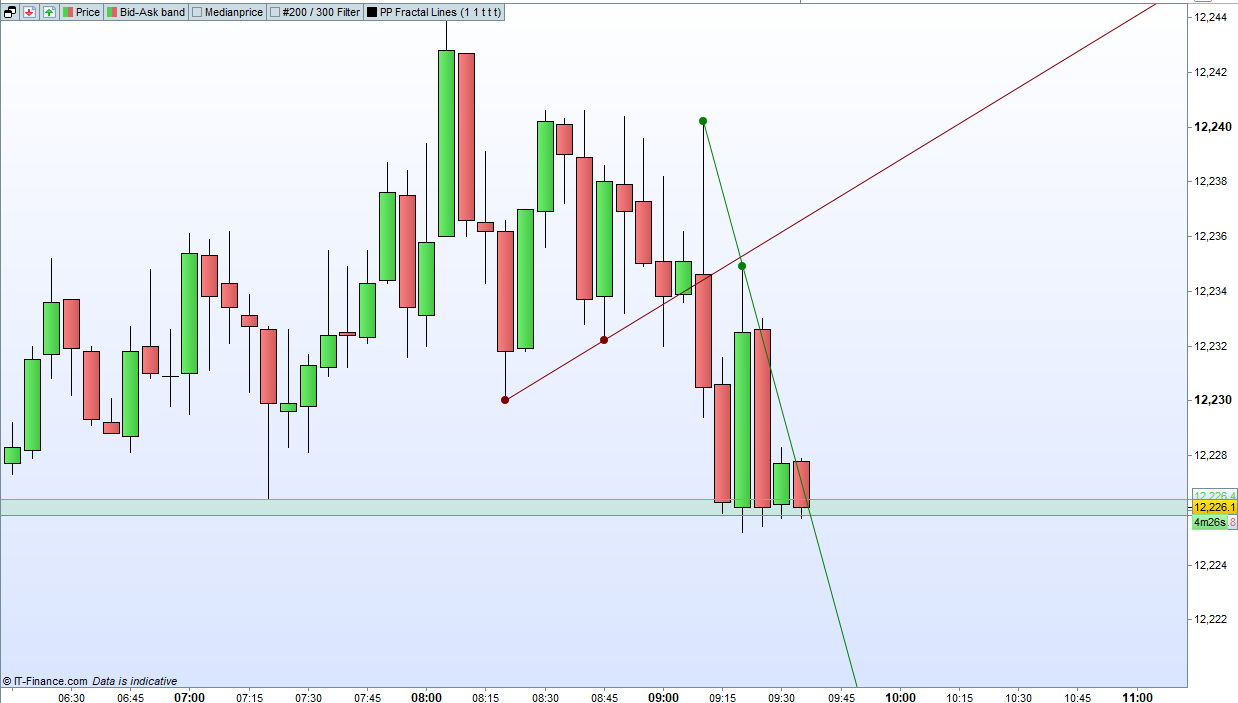
The above is my first attempt at it. It looks at the latest pair of Fractals and if they are in the correct order (rising or falling) then it uses them. If not in the correct order it moves on to the next pair and checks them until it finds a pair that meets the criteria. This may not be exactly what you want and it will take a while for me to get my head around how to check the latest fractal with all previous fractals before moving to the second latest and checking that against all previous fractals until we find a suitable pairing.
I’m a bit busy with other stuff right now but will try to find time at some point.
Personally I think that trend lines are pretty useless as you can draw a line through any two values on a chart and then persuade yourself that it is a valid trend!
It didn’t need much time! Here is a version that checks the latest fractal and looks back for a fractal that meets the criteria. If there isn’t one then it uses the second last fractal and does the same checks. Not extensively tested!
//parthapersonal Fractals v1.1
//PRT v11
//By Vonasi
//Date: 20201217

defparam drawonlastbaronly = true
//Settings
//BarsBefore = 1
//BarsAfter = 1
//Support = 1
//Resistance = 1
//Points = 1

//Make sure all settings are valid ones
BarsBefore = max(BarsBefore,1)
BarsAfter = max(BarsAfter,1)
StartBack = max(0,startback)

if barindex >= barsbefore + barsafter then

//Look for a low fractal
BarLookBack  = BarsAfter + 1
if low[BarsAfter] < lowest[BarsBefore](low)[BarLookBack] THEN
if low[BarsAfter] = lowest[BarLookBack](low) THEN
a = a + 1
$supportbar[a] = barindex[barsafter]
$supportvalue[a] = low[barsafter]
endif
endif

//Look for a high fractal
if high[BarsAfter] > highest[BarsBefore](high)[BarLookBack] THEN
if high[BarsAfter] = highest[BarLookBack](high) THEN
b = b + 1
$resistancebar[b] = barindex[barsafter]
$resistancevalue[b] = high[barsafter]
endif
endif

if islastbarupdate then
//support line
if a >= 2 then
if support then
flag = 0
zz = 0
for z = a-zz downto 0
for xx = 1 to a
if $supportvalue[z] > $supportvalue[z-xx] then
drawray($supportbar[z-xx],$supportvalue[z-xx],$supportbar[z],$supportvalue[z]) coloured(128,0,0)
if points then
drawpoint($supportbar[z],$supportvalue[z],2) coloured(128,0,0)
drawpoint($supportbar[z-xx],$supportvalue[z-xx],2) coloured(128,0,0)
endif
flag = 1
break
endif
zz = zz + 1
next
if flag = 1 then
break
endif
zz = 0
next
endif
endif

//resistance line
if b >= 2 then
if resistance then
flag = 0
zz = 0
for z = b-zz downto 0
for xx = 1 to b
if $resistancevalue[z] < $resistancevalue[z-xx] then
drawray($resistancebar[z-xx],$resistancevalue[z-xx],$resistancebar[z],$resistancevalue[z]) coloured(0,128,0)
if points then
drawpoint($resistancebar[z],$resistancevalue[z],2) coloured(0,128,0)
drawpoint($resistancebar[z-xx],$resistancevalue[z-xx],2) coloured(0,128,0)
endif
flag = 1
break
endif
zz = zz + 1
next
if flag = 1 then
break
endif
zz = 0
next
endif
endif

endif
endif

return
Minor bug fix on the last bit of code that stops some crashes if it can’t find a pair of fractals to use:
//parthapersonal Fractals v1.2
//PRT v11
//By Vonasi
//Date: 20201217

defparam drawonlastbaronly = true
//Settings
//BarsBefore = 1
//BarsAfter = 1
//Support = 1
//Resistance = 1
//Points = 1

//Make sure all settings are valid ones
BarsBefore = max(BarsBefore,1)
BarsAfter = max(BarsAfter,1)
StartBack = max(0,startback)

if barindex >= barsbefore + barsafter then

//Look for a low fractal
BarLookBack  = BarsAfter + 1
if low[BarsAfter] < lowest[BarsBefore](low)[BarLookBack] THEN
if low[BarsAfter] = lowest[BarLookBack](low) THEN
a = a + 1
$supportbar[a] = barindex[barsafter]
$supportvalue[a] = low[barsafter]
endif
endif

//Look for a high fractal
if high[BarsAfter] > highest[BarsBefore](high)[BarLookBack] THEN
if high[BarsAfter] = highest[BarLookBack](high) THEN
b = b + 1
$resistancebar[b] = barindex[barsafter]
$resistancevalue[b] = high[barsafter]
endif
endif

if islastbarupdate then
//support line
if a >= 2 then
if support then
flag = 0
zz = 0
for z = a-zz downto 1
for xx = 1 to a
if z-xx < 1 then
break
endif
if $supportvalue[z] > $supportvalue[z-xx] then
drawray($supportbar[z-xx],$supportvalue[z-xx],$supportbar[z],$supportvalue[z]) coloured(128,0,0)
if points then
drawpoint($supportbar[z],$supportvalue[z],2) coloured(128,0,0)
drawpoint($supportbar[z-xx],$supportvalue[z-xx],2) coloured(128,0,0)
endif
flag = 1
break
endif
zz = zz + 1
next
if flag = 1 then
break
endif
zz = 0
next
endif
endif

//resistance line
if b >= 2 then
if resistance then
flag = 0
zz = 0
for z = b-zz downto 1
for xx = 1 to b
if z-xx < 1 then
break
endif
if $resistancevalue[z] < $resistancevalue[z-xx] then
drawray($resistancebar[z-xx],$resistancevalue[z-xx],$resistancebar[z],$resistancevalue[z]) coloured(0,128,0)
if points then
drawpoint($resistancebar[z],$resistancevalue[z],2) coloured(0,128,0)
drawpoint($resistancebar[z-xx],$resistancevalue[z-xx],2) coloured(0,128,0)
endif
flag = 1
break
endif
zz = zz + 1
next
if flag = 1 then
break
endif
zz = 0
next
endif
endif

endif
endif

return
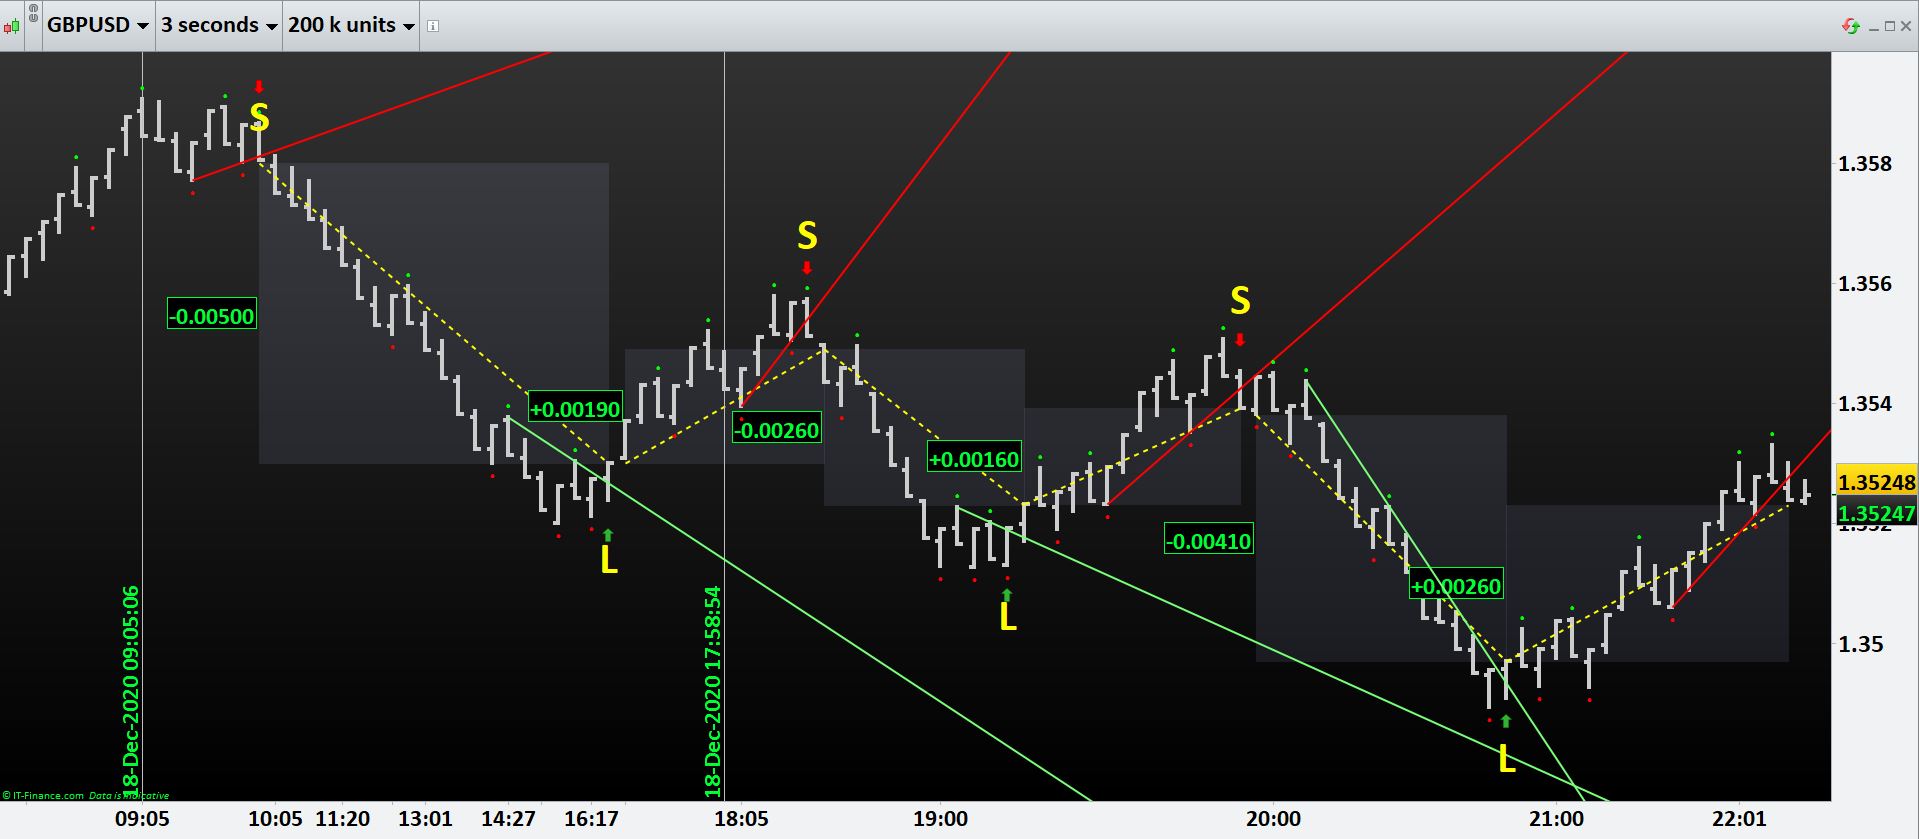
This is just magic at your finger tips. Bravo, my dear. I could not praise more, your helping attitude and un-parallel zest to code something very new. I exactly got what was looking for. I was drawing all these manually. Many thanks dear Vonasi. You are just brilliant.
On your personal note, I beg to differ with you. Actually it can be extremely helpful if it is used properly in intra-day as enclosed.
Again, thanks a lot dear.
Best regards,