It would be nice if there was an ability to turn off the auto-Y-scale at an individual chart panel level, adding the ability to set a range would be icing on cake.
Probability 50/50 says that next 7 years may level up, and feature may appear, but somehow I think we may be in a bigger drawdown. NOT (Ha!)
I looked to see if there was a work around, bearing in mind, this can have undue consequences which may be worst that the problem it solves, depending on complexity and operation.
The auto y-scale appears based round the highest and lowest value appearing in the chart panel window.
The variable(s) value(s) that trigger the auto Y-scale are those that are drawn via the RETURN line and/or certain DRAWx… keywords like DRAWCANDLE.
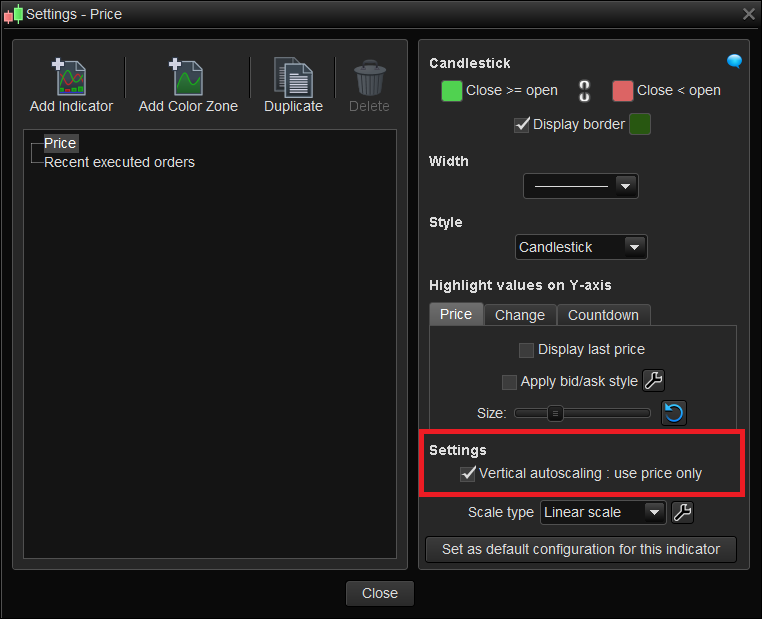
The hidden code used in the PRICE indicator, to display the candles in the price panel of a chart, which is like using DRAWCANDLE, trigger the auto y-scale, but there is the option to turn the candles off.
So, re-drawing the candles without using DRAWCANDLE or the RETURN line avoid the Y-scale from altering, based on just the candles.
The RETURN keyword implies INDICATOR code which can display multiple variables, using the GRAPH commands, with back-test, it is similar to RETURN but for each variable.
Since no DRAWx… keyword can be used in back-test, this technique is going to be limited to an indicator.
With ‘Alt Candle’ in PRICE panel and PRICE candles turned off…
The ‘Alt Candle’ candle code draws the candles without DRAWCANDLE or RETURN line, this means the Price range has to be set manually. I suppose to turn off the price candles of a new chart, the price range would be set initially to normal. Without further testing, a re-opened chart with price candles already off, and price as moved outside of the saved range, I guess would not show the current price until manually alter the price range to suit.
Normal price candles have the ability to scale the size of a candle (body/wicks) depending on how many candles are displayed, though this may be achievable to some degree in code, the lack of feedback between what’s being displayed in the panel and code ability means there’s no way of automating it. So best is to go with a fixed size, though a couple of options could be coded and chosen from configure variable. Also, the brightness of Price candles is slightly different to achieve for some reason, maybe to do with background colour or the laying of colours by the system.
Though ‘Alt Candle’ can be used stand alone or in the price panel, with price panel candles turned off, the orders, alarms etc. will be correctly displayed to the alt candles. This only happens with ‘PRICE’ panel indicator being present.
The ‘Alt Range’ code presents the feature for setting a price range. Where ‘Alt Candle’ avoids triggering the auto Y-scale, ‘Alt Range’ uses it with the RETURN line variables to set the panel to an approximate range via configure variables.
Though I’ve used default values for the code, further code could be written to defaults to more sensible values. It hard to set defaults here because of the wide scope of price ranges of different instrument.
It could be set to the highest and lowest of all chart bars, or say last 100 bars etc. Its somewhat possible to determine what the unit size of a chart is ,but that’s still work in progress.
From a pro and cons point of view and without testing every possible scenario:
Pro’s: Avoids auto Y-scale; set fixed price range;
Con’s: No candle price values shown (cursor/labels); Adding normal indicator will re-trigger auto y-scale
I’m sure using the ‘ALTs’ the lists will get longer depending on how used or other PRT features required, however to some degree some con’s can be partially over come with selecting invisible lines and/or customer indicators drawing using DRAWSEGMENT.
Anyway, it maybe only be usable as a sort of indicator, if usable, post any issues you come across, maybe there a solution/work around or warning.
Regards all
// ohlc values
op=open
hi=high
lo=low
cl=close

a = 255

if max(open,close) = open then // if bear
r=220
g=100
b=100
drawrectangle(barindex ,op,barindex,cl) coloured(r,g,b,a)bordercolor(r,g,b,a) style(line,4) // body
drawsegment(barindex, hi,barindex,lo)coloured(r,g,b,a) // wicks
else // if bull (other)
r=80
g=210
b=80
drawrectangle(barindex ,op,barindex,cl) coloured(r,g,b,a)bordercolor(r,g,b,a)style(line,4) // body
drawsegment(barindex, hi,barindex,lo) coloured(r,g,b,a) // wicks
endif

return
[ don’t forget to set up dynamic variables shown on lines 3,4 and 5 or remove the // from the beginning of the lines and set your own default values ]
DEFPARAM DRAWONLASTBARONLY = TRUE

// LOrange = 0       // decimal
// HIrange = 100000  // decimal
// visible = 1       // boolean

a = 0
if visible = 1 then
a = 255

drawtext("HI Range",barindex+5,HIrange)
drawtext("LO Range",barindex+5,LOrange)
endif


return HIrange as"HI Range" coloured("grey",a) style(dottedline,1),LOrange as"LO Range" coloured("grey",a) style(dottedline,1)