Lowest low, highest high – seasonality
Forums › ProRealTime English forum › ProOrder support › Lowest low, highest high – seasonality
- This topic has 6 replies, 4 voices, and was last updated 8 years ago by
air.
-
-
01/10/2017 at 4:30 PM #2054501/10/2017 at 5:03 PM #20555
Sorry,
Just to be more precise. It should report the date of the lowest/highest point of a certain market during its entire history. During the year, seasonally, when the Dax (or any other market) hits the bottom and when it hits the top?
Thank you agan.
01/11/2017 at 4:02 AM #2064201/12/2017 at 6:32 AM #20815Good day Chowfei,
Thank you for your kind reply and indicator.
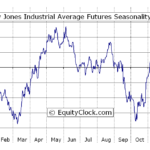
If I plotted the ind correctly, it results in a higher/ lower band. What I a am really looking for is the seasonal high and low during a calendar year calculated over the whole data base.
I am enclosing a chart of the DJ as an example,
Thank you again.
air.
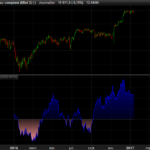
01/12/2017 at 3:12 PM #20868Here is what I can do for seasonal indicator. Seems quite similar as your example, this one have been calculated from 2000 to 2016, since I don’t know from how many years yours has been computed, I don’t know if the little noticeable differences come from that.
Is your request has something to deal with the pathfinder trading strategy seasonality factor? I think this indicator could be of interest of members who contribute to these topics.
01/12/2017 at 5:39 PM #2089501/12/2017 at 7:33 PM #20902 -
AuthorPosts