Hi,
I’m looking for a MACD indicator that changes the Histogram color with reference to the last bar eg. current bar higher than previous bar= green and lower than previous bar= red). I tried downloading the MACD histogram color indicator but notice that it behaves completely different from the built-in MACD. I would really appreciate if someone could point me to a solution or alternative indicator if available.
Thank you
There you go:
// MACD 12,26,9
//
MyMACD       = ExponentialAverage[12](close) - ExponentialAverage[26](close)
MySignalLine = ExponentialAverage[9](MyMACD)
MyHisto      = MyMACD - MySignalLine
r            = 0
g            = 255    //Green
b            = 0
IF high < high[1] THEN
   r = 255            //Red
   g = 0
ENDIF
RETURN MyMACD coloured(0,0,238,255) Style(Line,1) AS "Macd",MySignalLine coloured(238,99,99,255) Style(Line,1) AS "Signal",MyHisto coloured(r,g,b,255) Style(Histogram,1) AS "Histogram"
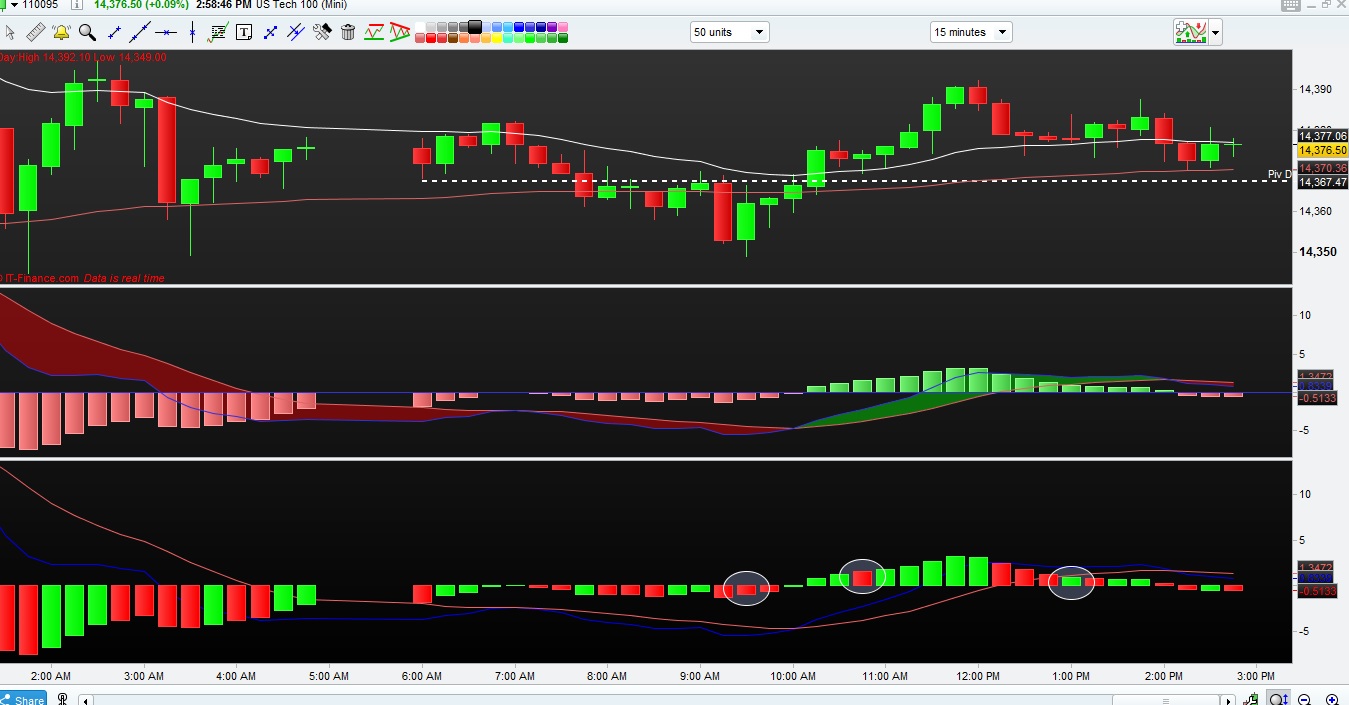
Thank you Sir. I’ve tried the indicator and noticed that it still doesn’t color all the bars correctly. I’ve attached a sample screen shot with the default MACD on top and the MACD histogram color at the bottom. I’ve marked some of the bars where the color is off. Really appreciate some help to solve this.
Best Regards
not sure if the attachment went thru earlier
They are ALL correct, as per your request “eg. current bar higher than previous bar= green and lower than previous bar= red“.
Any bar higher than the previous one is GREEN, otherwise it’s RED.
Hi Sir ,
My apologies for the confusion. What I meant is that if the macd histogram bar is increasing with respect to the last one, it should color the forming bar green. Conversely, if its is declining with respect to the previous bar, then the bar should paint red.
Regards
If the higher is higher than before it must be green, if the low is lower than before it’s red, is this correct!
In all other cases what colour should it have?
To check for ascending and descending prices shall I use CLOSE or HIGH/LOW?
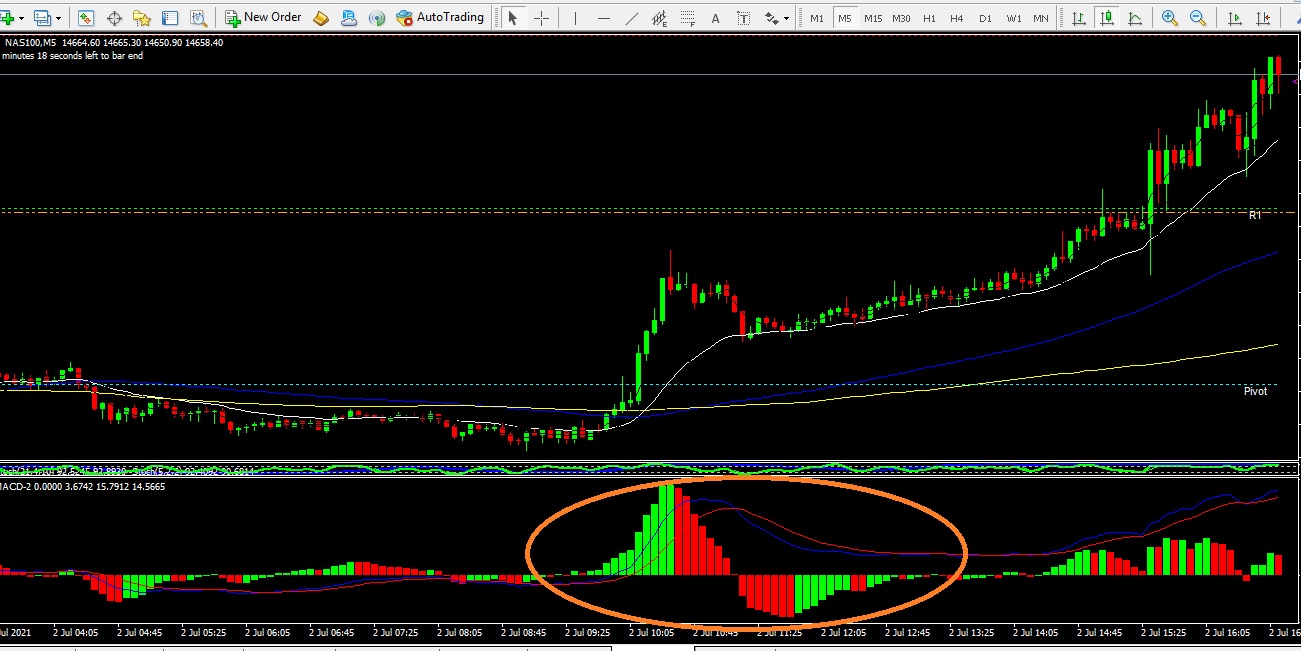
Hi Sir, please refer to the attached chart from MT4. I’m trying to get the indicator to do the same in PRT.
When a bar is above 0 line and increasing in value ie becoming more postive wrt previous bar, it should paint green and signal a change to red if it go lower than previous bar.
When a bar is below 0 line and becoming more negative wrt previous bar , the bar should paint red. If it’s below o line and becoming more positive wrt last bar, it should paint green.
There you go:
// MACD 12,26,9
//
MyMACD       = ExponentialAverage[12](close) - ExponentialAverage[26](close)
MySignalLine = ExponentialAverage[9](MyMACD)
MyHisto      = MyMACD - MySignalLine
ONCE b       = 0
IF (MyMACD > MyMACD[1]) AND (MyMACD > 0) THEN
   r         = 0
   g         = 255    //Green
ENDIF
IF (MyMACD < MyMACD[1]) AND (MyMACD <= 0) THEN
   r         = 255            //Red
   g         = 0
ENDIF
RETURN MyMACD coloured(0,0,238,255) Style(Line,1) AS "Macd",MySignalLine coloured(238,99,99,255) Style(Line,1) AS "Signal",MyHisto coloured(r,g,b,255) Style(Histogram,1) AS "Histogram"
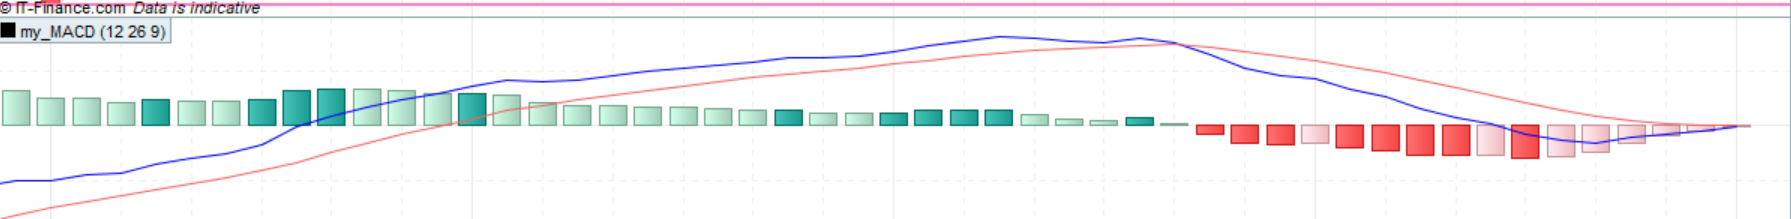
Hi, i tried copying the code into the indicator and am getting strange output as attached.
[attachment file=”173058″]
Create Variables called ShortTermMA, LongTermMA and SignalNBRPeriods, and set them to your liking, e.g. 14, 32 and 9
MyMACD = ExponentialAverage[ShortTermMA](close) - ExponentialAverage[LongTermMA](close)
MySignalLine = ExponentialAverage[SignalNBRPeriods](MyMACD)
MyHisto = MyMACD - MySignalLine

r = 0
g = 0
b = 0

IF MyHisto > 0 THEN
// Normal Green
IF MyHisto[1] < MyHisto THEN
r = 38
g = 166
b = 154
ENDIF
// Light Green
IF MyHisto[1] > MyHisto THEN
r = 178
g = 223
b = 202
ENDIF
ENDIF

IF MyHisto < 0 THEN
// Normal Red
IF MyHisto[1] > MyHisto THEN
r = 255
g = 82
b = 82
ENDIF

// Light Red
IF MyHisto[1] < MyHisto THEN
r = 255
g = 205
b = 210
ENDIF
ENDIF

RETURN MyHisto coloured(r,g,b,255) Style(Histogram,1) AS "Histogram", MyMACD coloured(0,0,238,255) Style(Line,1) AS "Macd",MySignalLine coloured(238,99,99,255) Style(Line,1) AS "Signal"
Thank you so much. It’s perfect now.