Bard
BardParticipant
Master
Yes that would make sense, more likelihood of clashing orders in a 1 min TF compared to daily or 4 hr. When I decreased the boxsize from 100 to 50 I then got a tbt warning whereas before it hadn’t given me tbt warning during the 100 boxsize test?
BardParticipant
Master
@Vonasi, even just having”dead” optimisation variables for qty and Random left in a system, despite no actual VRT code in the system, makes a difference to the results.
I just compared the same system today with a screenshot of profit results from a few days ago. The system today has no VRT code as I stripped it out, but it still contained “dead” optimisation settings (Q: 2 to 10and R: 1 to 10) at the top.
I could not replicate the results today with those from a few days ago? I had to delete the Q and R settings from the optimisation variables window first before the results then matched with those of a few days ago? Any ideas!?
The question though, is why is the VRT code giving different results compared to a non VRT system with the same code?
Not sure what you mean and I can’t get anything useful from your screenshot because I don’t have a magnifying glass powerful enough.
Do you mean that you have a strategy with the VRT code in it but turned off and an identical strategy but with no VRT code in it at all and they return different results? If so then the only answer can be because the strategy part of the code is not identical or the variable settings are not identical or they are being tested on different data samples.
I had to delete the Q and R settings from the optimisation variables window first before the results then matched with those of a few days ago? Any ideas!?
I don’t recall the variables being called Q and R in the robustness tester – they were Qty and Random – or are you abbreviating? If not then perhaps there are variables in the strategy code called Q and R – as I say I’ve not looked at the code.
I don’t recall the variables being called Q and R
I changed them to q and r cuz i’m lazy. Bard has my version of the VRT
BardParticipant
Master
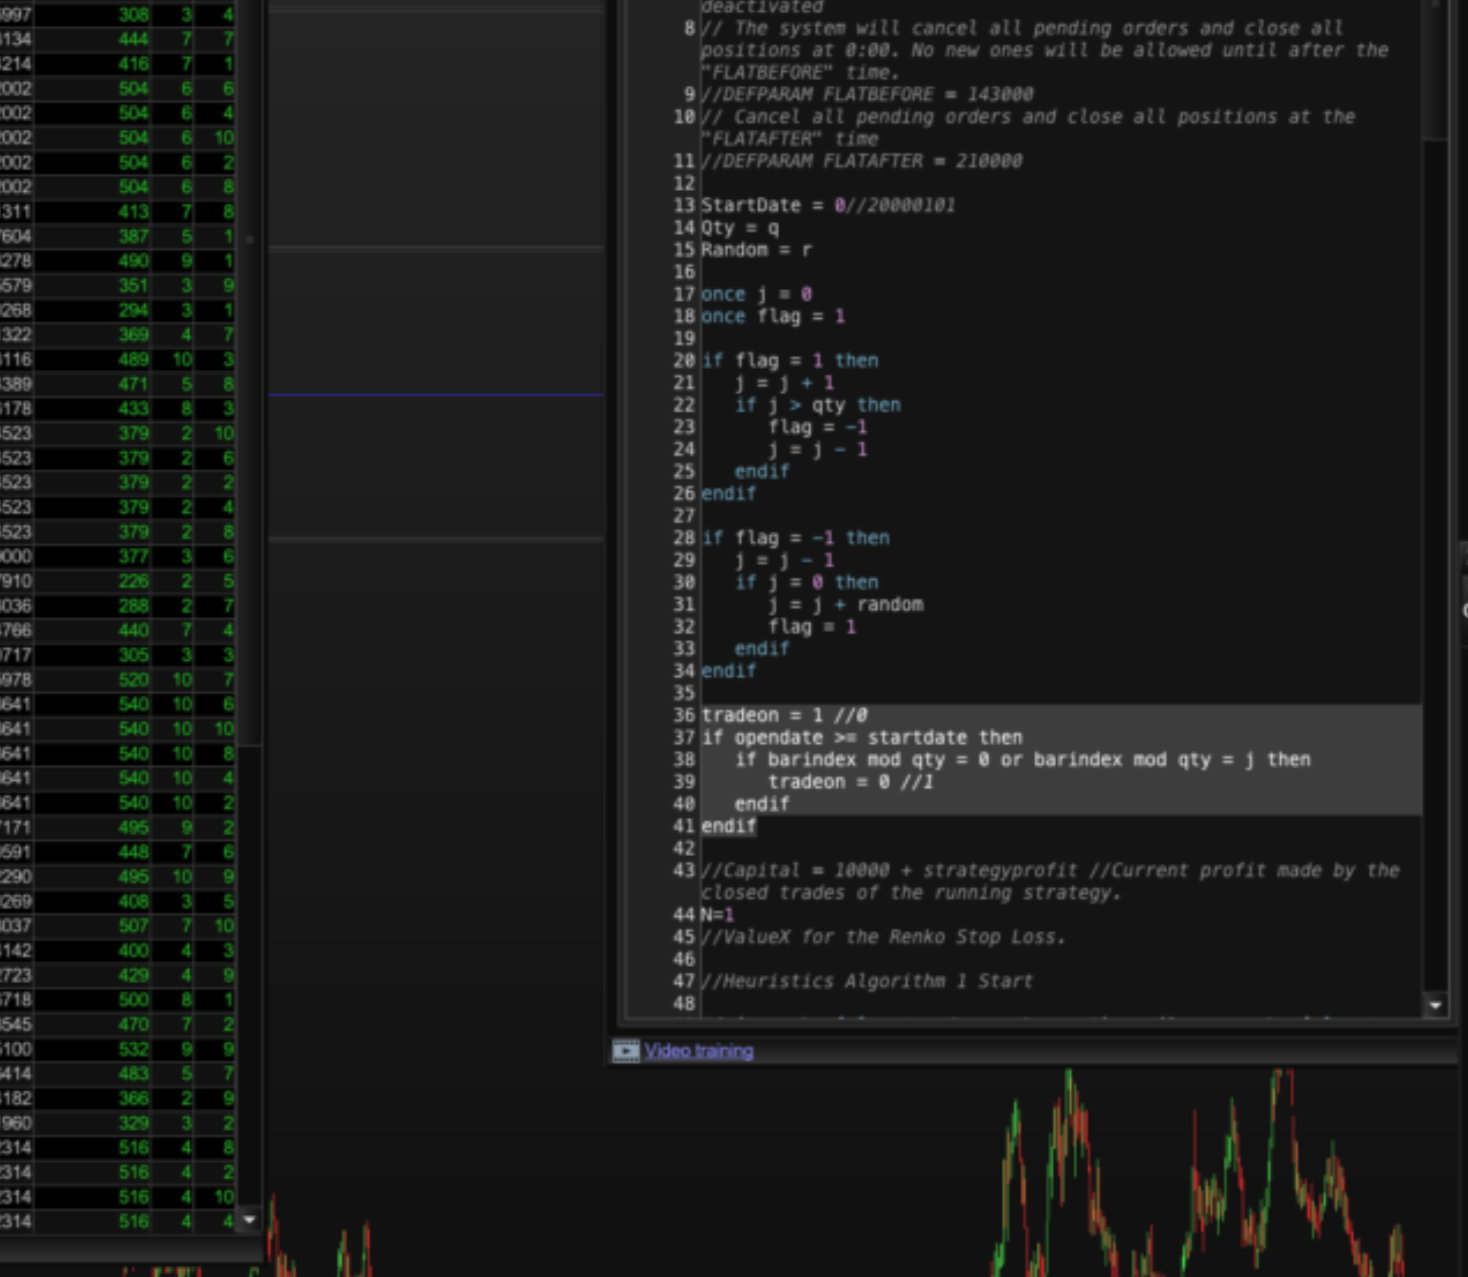
Not sure what you mean and I can’t get anything useful from your screenshot because I don’t have a magnifying glass powerful enough.
The screen relates to tradeon=1 and it not working to turn off the VRT. The screenshot was taken on a 50″ LG tv. This is it zoomed in: Pls see image.
Do you mean that you have a strategy with the VRT code in it but turned off.
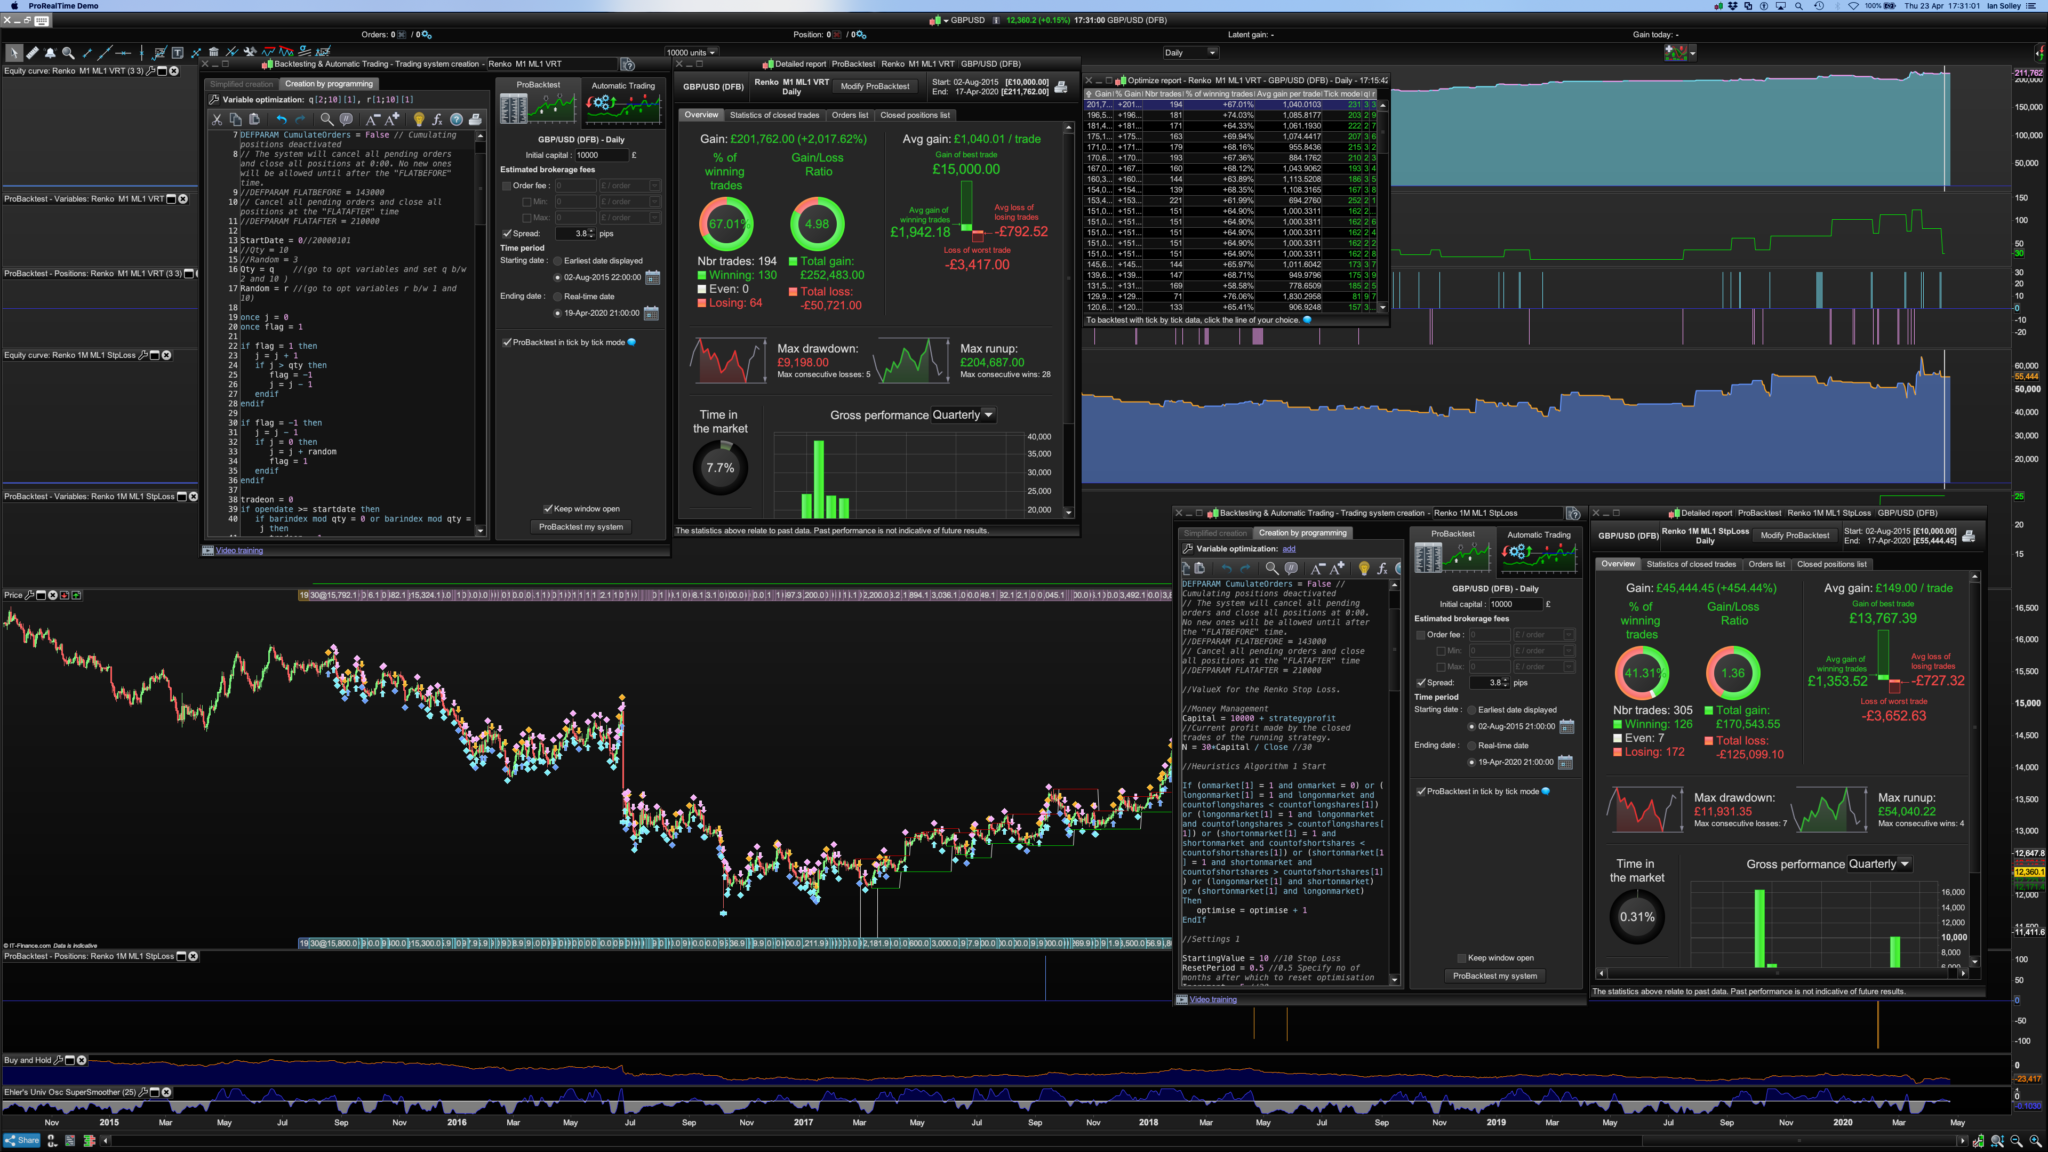
Yes, all rem’d out and tradeon taken out of “If buy and sell statements.” The only part of the VRT I left in was the variables in the very top of the system creation window and it made a big +ve difference to the profits. (Yes they’re abbreviations for qty and random). I can also test a non VRT system against a complete (and non rem’d) VRT coded system and the results are very different compared to the non VRT version but I’m guessing that’s not meant to happen? Pls see screen with VRT version makes £211k – top equity curve whilst Bottom equity curve and not a VRT system makes £55k:
Code otherwise identical thanks to text-compare.com
When you said:
“Click on the avg gain per trade tab in the optimiser window to organise the results in low to high and also drag the results into Excel.“
Did you mean that the smallest numbers at the bottom and largest at the top, only reading the Robustness thread I saw GraHal had a google spreadsheet with the smallest values at the top and the largest at the bottom which threw me? I’m really looking forward to getting Excel to behave and using this great piece of kit! Cheers.
Did you mean that the smallest numbers at the bottom and largest at the top
No – smallest at the top. Excel draws graphs using values from the top of the data to the bottom. You will notice that all the graphs slope up from left to right so that is low to high.
I just downloaded and imported Nonetheless’s last posted ITF and added the code I posted earlier to allow me to turn the VRT on or off and it worked just fine. With VRT off all the results were identical and with it on they were all different. I then // out all the VRT code and just left tradeon = 1 in the code and it returned one result that was identical to with the VRT code in the strategy but turned off.
This works well for modifying the period and type of an MA. I included an on/off so can be isolated.
ONCE EnableHeuristics = 1

If EnableHeuristics = 1 then // Start of Heuristics Algorithm 1
If onmarket[1] = 1 and onmarket = 0 Then
optimize = optimize + 1
EnDif

StartingValue = 45
ResetPeriod = 10 //Specify no of months after which to reset optimization
Increment = 5
MaxIncrement = 10 //Limit of no of increments either up or down
Reps = 20 //Number of trades to use for analysis
MaxValue = 75 //Maximum allowed value
MinValue = 25 //Minimum allowed value

once monthinit = month
once yearinit = year
If (year = yearinit and month = (monthinit + ResetPeriod)) or (year = (yearinit + 1) and ((12 - monthinit) + month = ResetPeriod)) Then
ValueX = StartingValue
WinCountB = 0
StratAvgB = 0
BestA = 0
BestB = 0
monthinit = month
yearinit = year
EndIf
once ValueX = StartingValue
once PIncPos = 1 //Positive Increment Position
once NIncPos = 1 //Neative Increment Position
once Optimize = 0 ////Initialize Heuristicks Engine Counter (Must be Incremented at Position Start or Exit)
once Mode = 1 //Switches between negative and positive increments
//once WinCountB = 3 //Initialize Best Win Count
//GRAPH WinCountB coloured (0,0,0) AS "WinCountB"
//once StratAvgB = 4353 //Initialize Best Avg Strategy Profit
//GRAPH StratAvgB coloured (0,0,0) AS "StratAvgB"

If Optimize = Reps Then
WinCountA = 0 //Initialize current Win Count
StratAvgA = 0 //Initialize current Avg Strategy Profit

For i = 1 to Reps Do
If positionperf(i) > 0 Then
WinCountA = WinCountA + 1 //Increment Current WinCount
EndIf
StratAvgA = StratAvgA + (((PositionPerf(i)*countofposition[i]*100000)*-1)*-1)
Next
StratAvgA = StratAvgA/Reps //Calculate Current Avg Strategy Profit
//Graph (PositionPerf(1)*countofposition[1]*100000)*-1 as "PosPerf1"
//Graph (PositionPerf(2)*countofposition[2]*100000)*-1 as "PosPerf2"
//Graph StratAvgA*-1 as "StratAvgA"
//once BestA = 300
//GRAPH BestA coloured (0,0,0) AS "BestA"
If StratAvgA >= StratAvgB Then
StratAvgB = StratAvgA //Update Best Strategy Profit
BestA = ValueX
EndIf
//once BestB = 300
//GRAPH BestB coloured (0,0,0) AS "BestB"
If WinCountA >= WinCountB Then
WinCountB = WinCountA  //Update Best Win Count
BestB = ValueX
EndIf

If WinCountA > WinCountB and StratAvgA > StratAvgB Then
Mode = 0
ElsIf WinCountA < WinCountB and StratAvgA < StratAvgB and Mode = 1 Then
ValueX = ValueX - (Increment*NIncPos)
NIncPos = NIncPos + 1
Mode = 2
ElsIf WinCountA >= WinCountB or StratAvgA >= StratAvgB and Mode = 1 Then
ValueX = ValueX + (Increment*PIncPos)
PIncPos = PIncPos + 1
Mode = 1
ElsIf WinCountA < WinCountB and StratAvgA < StratAvgB and Mode = 2 Then
ValueX = ValueX + (Increment*PIncPos)
PIncPos = PIncPos + 1
Mode = 1
ElsIf WinCountA >= WinCountB or StratAvgA >= StratAvgB and Mode = 2 Then
ValueX = ValueX - (Increment*NIncPos)
NIncPos = NIncPos + 1
Mode = 2
EndIf

If NIncPos > MaxIncrement or PIncPos > MaxIncrement Then
If BestA = BestB Then
ValueX = BestA
Else
If reps >= 10 Then
WeightedScore = 10
Else
WeightedScore = round((reps/100)*100)
EndIf
ValueX = round(((BestA*(20-WeightedScore)) + (BestB*WeightedScore))/20) //Lower Reps = Less weight assigned to Win%
EndIf
NIncPos = 1
PIncPos = 1
ElsIf ValueX > MaxValue Then
ValueX = MaxValue
ElsIf ValueX < MinValue Then
ValueX = MinValue
EndIF

Optimize = 0
EndIf

// End of Heuristics Algorithm 1 ; Start of Heuristics Algorithm 2

If onmarket[1] = 1 and onmarket = 0 Then
optimize2 = optimize2 + 1
EnDif

StartingValue2 = 3
ResetPeriod2 = 10 //Specify no of months after which to reset optimization
Increment2 = 1
MaxIncrement2 = 8 //Limit of no of increments either up or down
Reps2 = 20 //Number of trades to use for analysis
MaxValue2 = 8 //Maximum allowed value
MinValue2 = 0 //Minimum allowed value

once monthinit2 = month
once yearinit2 = year
If (year = yearinit2 and month = (monthinit2 + ResetPeriod2)) or (year = (yearinit2 + 1) and ((12 - monthinit2) + month = ResetPeriod2)) Then
ValueY = StartingValue2
WinCountB2 = 0
StratAvgB2 = 0
BestA2 = 0
BestB2 = 0
monthinit2 = month
yearinit2 = year
EndIf
once ValueY = StartingValue2
once PIncPos2 = 1 //Positive Increment Position
once NIncPos2 = 1 //Neative Increment Position
once Optimize2 = 0 ////Initialize Heuristicks Engine Counter (Must be Incremented at Position Start or Exit)
once Mode2 = 1 //Switches between negative and positive increments
//once WinCountB = 3 //Initialize Best Win Count
//GRAPH WinCountB coloured (0,0,0) AS "WinCountB"
//once StratAvgB = 4353 //Initialize Best Avg Strategy Profit
//GRAPH StratAvgB coloured (0,0,0) AS "StratAvgB"

If Optimize2 = Reps2 Then
WinCountA2 = 0 //Initialize current Win Count
StratAvgA2 = 0 //Initialize current Avg Strategy Profit

For i = 1 to Reps2 Do
If positionperf(i) > 0 Then
WinCountA2 = WinCountA2 + 1 //Increment Current WinCount
EndIf
StratAvgA2 = StratAvgA2 + (((PositionPerf(i)*countofposition[i]*100000)*-1)*-1)
Next
StratAvgA2 = StratAvgA2/Reps2 //Calculate Current Avg Strategy Profit
//Graph (PositionPerf(1)*countofposition[1]*100000)*-1 as "PosPerf1"
//Graph (PositionPerf(2)*countofposition[2]*100000)*-1 as "PosPerf2"
//Graph StratAvgA*-1 as "StratAvgA"
//once BestA = 300
//GRAPH BestA coloured (0,0,0) AS "BestA"
If StratAvgA2 >= StratAvgB2 Then
StratAvgB2 = StratAvgA2 //Update Best Strategy Profit
BestA2 = ValueY
EndIf
//once BestB = 300
//GRAPH BestB coloured (0,0,0) AS "BestB"
If WinCountA2 >= WinCountB2 Then
WinCountB2 = WinCountA2  //Update Best Win Count
BestB2 = ValueY
EndIf

If WinCountA2 > WinCountB2 and StratAvgA2 > StratAvgB2 Then
Mode2 = 0
ElsIf WinCountA2 < WinCountB2 and StratAvgA2 < StratAvgB2 and Mode2 = 1 Then
ValueY = ValueY - (Increment2*NIncPos2)
NIncPos2 = NIncPos2 + 1
Mode2 = 2
ElsIf WinCountA2 >= WinCountB2 or StratAvgA2 >= StratAvgB2 and Mode2 = 1 Then
ValueY = ValueY + (Increment2*PIncPos2)
PIncPos2 = PIncPos2 + 1
Mode2 = 1
ElsIf WinCountA2 < WinCountB2 and StratAvgA2 < StratAvgB2 and Mode2 = 2 Then
ValueY = ValueY + (Increment2*PIncPos2)
PIncPos2 = PIncPos2 + 1
Mode2 = 1
ElsIf WinCountA2 >= WinCountB2 or StratAvgA2 >= StratAvgB2 and Mode2 = 2 Then
ValueY = ValueY - (Increment2*NIncPos2)
NIncPos2 = NIncPos2 + 1
Mode2 = 2
EndIf

If NIncPos2 > MaxIncrement2 or PIncPos2 > MaxIncrement2 Then
If BestA2 = BestB2 Then
ValueY = BestA2
Else
If reps2 >= 10 Then
WeightedScore2 = 10
Else
WeightedScore2 = round((reps2/100)*100)
EndIf
ValueY = round(((BestA2*(20-WeightedScore2)) + (BestB2*WeightedScore2))/20) //Lower Reps = Less weight assigned to Win%
EndIf
NIncPos2 = 1
PIncPos2 = 1
ElsIf ValueY > MaxValue2 Then
ValueY = MaxValue2
ElsIf ValueY < MinValue2 Then
ValueY = MinValue2
EndIF

Optimize2 = 0
EndIf
graph valuex coloured(0,255,0,255) as "period"
graph valuey coloured(255,0,0,255) as "type"
// Heuristics Algorithm 2 End
endif

If EnableHeuristics = 0 then
ValueX = 45
ValueY = 3
endif

ma = average[ValueX,ValueY](close)
cnd1 = ma > ma[1]
cnd2 = ma < ma[1]
Good morning,
I find that the while loop is a duplicate with the if condition.
You tried without the loop while
IF high > renkoMax + boxSize THEN
WHILE high > renkoMax + boxSize
renkoMax = renkoMax + boxSize
renkoMin = renkoMin + boxSize
WEND
ELSIF low < renkoMin - boxSize THEN
WHILE low < renkoMin - boxSize
renkoMax = renkoMax - boxSize
renkoMin = renkoMin - boxSize
WEND
ENDIF
My browser e-find tells me there is 6 instances of ‘while’ on this page, but I can’t find two of them??
Nonetheless posted code has no ‘while’ in the code?
So I’ll have to ask … Fifi, who are you speaking to and which System are you referring to please?
The bard code
The code set out on page 13
The results are different with and without the while loop.
The code set out on page 13
It’s always best if we Quote a small / most relevant part of the post we are referring to (as I have above) else folks will assume (as I did) that we are referring to the post immediately above our post.
I referred to the code renko 1 m ML1 stploss
I find that the while loop is a duplicate with the if condition.
You tried without the loop
So below is Bard’s code (from page 13 Line 145 to Line 155) which is the same as you show in your post?
So what should Bard have done with the code?
IF high > renkoMax + boxSize THEN
WHILE high > renkoMax + boxSize
renkoMax = renkoMax + boxSize
renkoMin = renkoMin + boxSize
WEND
ELSIF low < renkoMin - boxSize THEN
WHILE low < renkoMin - boxSize
renkoMax = renkoMax - boxSize
renkoMin = renkoMin - boxSize
WEND
ENDIF