Expert Services
 ProRealCode - Trading & Coding with ProRealTime™

No recent search
Machine Learning in ProOrder ProRealTime
- Forums
- ProRealTime English Forum
- ProOrder: Automated Strategies & Backtesting
- Machine Learning in ProOrder ProRealTime
-
AuthorPosts
-
1. Moreover generally the parameter where the best we obtain with a backtest and changing the valuex will result in choosing a worst combinaison of values
2. And to conclude determining that a valuex of 12 the 4 april doesn’t mean it will be the best value for the 12 april for exampleSurely you have sort of answered your own question 1 with the bold text in question 2?
It may be that the System you are experimenting with has variable values (arrived at via normal optimisation / WF etc) that are at their best ever value?
If the Heuristics are used in a System where a variable optimum value can changes every day or so (like the Renkos we have been using on this Topic) then the Heurisitic on the fly optimisation can improve results.
Also important to note that each discovery session is determined by ‘MaxIncrement’ (number of increments to try). After this the strategy then tests the newly discovered best values for a number of trades as defined by ‘Reps’. It then compares the results to the previous discovery session and overall best values to see whether progress was made.
Unfortunately determining true market cycles is extremely challenging and for now the heuristics (i.e. discovery through ‘trial and error’) is my best shot at dynamic optimization.
Bard thanked this postAlso important to note that each discovery session is determined by ‘MaxIncrement’ (number of increments to try). After this the strategy then tests the newly discovered best values for a number of trades as defined by ‘Reps’. It then compares the results to the previous discovery session and overall best values to see whether progress was made.
Unfortunately determining true market cycles is extremely challenging and for now the heuristics (i.e. discovery through ‘trial and error’) is my best shot at dynamic optimization.
the strategy then tests the newly discovered best values for a number of trades as defined by ‘Reps
It’s like a forward test in live, right ? But with the risk it getting worst with losing trades with the new values ?
@juanj a while back we discussed about the importance of MFA/MAE ratio.
If you had a stoploss of 500points and a target of 50 points, takes the current way of calculation parameters into account that if the trade goes -450 before it reached 50 points it wasn’t very good entry or does it see as a positive trade and parameters which could be used again?
@Bard
“Unfortunately SET STOP PTRAILING does not use tick by tick data and so gives false results.” That’s a bunch of time wasted. Knew there was something off but not exactly what.
Atleast v4 ts had this covered. I thought the order would be rejected, but as it stands it was accepted today and having good results.
Bard thanked this postAn other idea came to mind.
instead of use ML for parameters, what about using the optimistation results and group the first 10 rows with parameters.
Then ML can take out of those 10 row which set of parameters will be the best. Especially on a short timeframe (1s-10s), a few days later again optimisation can be made and the best set of parameters added to the first group, so you buildup data for ML which covers more market scenarios.
Baloney or interesting?
GraHal thanked this postTo continue, because it’s an intersting topic (Thanks @juanj and all contributors), I made a test
I use a very simple code
// Définition des paramètres du code
DEFPARAM CumulateOrders = False // Cumul des positions désactivé

// Conditions pour ouvrir une position acheteuse
indicator1 = ExponentialAverage[a](close)
indicator2 = ExponentialAverage[b](close)
c1 = (indicator1 CROSSES OVER indicator2)
indicator3 = WilderAverage[c](close)
c2 = (close > indicator3)

IF c1 AND c2 THEN
BUY 1 SHARES AT MARKET
ENDIF

// Conditions pour ouvrir une position en vente à découvert
indicator4 = ExponentialAverage[a](close)
indicator5 = ExponentialAverage[b](close)
c3 = (indicator4 CROSSES UNDER indicator5)
indicator6 = WilderAverage[c](close)
c4 = (close < indicator6)

IF c3 AND c4 THEN
SELLSHORT 1 SHARES AT MARKET
ENDIF

// Stops et objectifs
SET TARGET pPROFIT d
SET STOP pLOSS 2*d
On EUR/USD 1 minute. I do a backtest and obtain the “best” value who are a=30 b=60 c=30 d=4
I put these values in the Learning machine in Starting Value as you can see below with min/max as the values aroud these values on the backtest
defparam cumulateorders = false
//////////////////////////////////////////////////////////////
StartingValue = 30
ResetPeriod = 3 //Specify no of months after which to reset optimization
Increment = 1
MaxIncrement = 20 //Limit of no of increments either up or down
Reps = 3 //Number of trades to use for analysis
MinValue = 10 //Minimum allowed value
MaxValue = 100 //Maximum allowed value
//////////////////////////////////////////////////////////////
StartingValue2 = 60
ResetPeriod2 = 3 //Specify no of months after which to reset optimization
Increment2 = 1
MaxIncrement2 = 20 //Limit of no of increments either up or down
Reps2 = 3 //Number of trades to use for analysis
MinValue2 = 20 //Minimum allowed value
MaxValue2 = 100 //Maximum allowed value
//////////////////////////////////////////////////////////////
//period1=7
//period2=14

HeuristicsCycleLimit = 2
once HeuristicsCycle = 0
once HeuristicsAlgo1 = 1
once HeuristicsAlgo2 = 0
If HeuristicsCycle >= HeuristicsCycleLimit  Then
If HeuristicsAlgo1 = 1 Then
HeuristicsAlgo2 = 1
HeuristicsAlgo1 = 0
ElsIf HeuristicsAlgo2 = 1 Then
HeuristicsAlgo1 = 1
HeuristicsAlgo2 = 0
EndIf
HeuristicsCycle = 0
EndIf
//
//If HeuristicsAlgo1 = 1 Then

//Heuristics Algorithm 1 Start

If (onmarket[1] = 1 and onmarket = 0) or (longonmarket[1] = 1 and longonmarket and countoflongshares < countoflongshares[1]) or (longonmarket[1] = 1 and longonmarket and countoflongshares > countoflongshares[1]) or (shortonmarket[1] = 1 and shortonmarket and countofshortshares < countofshortshares[1]) or (shortonmarket[1] = 1 and shortonmarket and countofshortshares > countofshortshares[1]) or (longonmarket[1] and shortonmarket) or (shortonmarket[1] and longonmarket) Then
optimize = optimize + 1
EndIf

If monthinit = 1 or monthinit = 3 or monthinit = 5 or monthinit = 7 or monthinit = 8 or monthinit = 10 or monthinit = 12 Then
MonthDays = 31
ElsIf monthinit = 4 or monthinit = 6 or monthinit = 9 or monthinit = 11 Then
MonthDays = 30
ElsIf monthinit = 2 Then
If (yearinit/4 = round(yearinit/4)) or (yearinit/400 = round(yearinit/400)) Then //haha not sure how exactly to do this
MonthDays = 29 //leap year
Else
MonthDays = 28
EndIf
EndIf

If (month = monthinit and day = dayinit + ResetPeriod) or (month = monthinit + 1 and (day + (MonthDays - dayinit)) >= ResetPeriod) Then
ValueX = StartingValue
WinCountB = 0
StratAvgB = 0
BestA = 0
BestB = 0
dayinit = day
monthinit = month
yearinit = year
EndIf

once ValueX = StartingValue
once PIncPos = 1 //Positive Increment Position
once NIncPos = 1 //Neative Increment Position
once Optimize = 0 ////Initialize Heuristicks Engine Counter (Must be Incremented at Position Start or Exit)
once Mode = 1 //Switches between negative and positive increments
//once WinCountB = 3 //Initialize Best Win Count
//GRAPH WinCountB coloured (0,0,0) AS "WinCountB"
//once StratAvgB = 4353 //Initialize Best Avg Strategy Profit
//GRAPH StratAvgB coloured (0,0,0) AS "StratAvgB"

If Optimize = Reps Then
WinCountA = 0 //Initialize current Win Count
StratAvgA = 0 //Initialize current Avg Strategy Profit
HeuristicsCycle = HeuristicsCycle + 1

For i = 1 to Reps Do
If positionperf(i) > 0 Then
WinCountA = WinCountA + 1 //Increment Current WinCount
EndIf
//StratAvgA = StratAvgA + (((PositionPerf(i)*countofposition[i]*100000)*-1)*-1)
StratAvgA = StratAvgA + (((PositionPerf(i)*pointvalue)*countofposition[i])/pipsize)

Next
StratAvgA = StratAvgA/Reps //Calculate Current Avg Strategy Profit
//Graph (PositionPerf(1)*countofposition[1]*100000)*-1 as "PosPerf1"
//Graph (PositionPerf(2)*countofposition[2]*100000)*-1 as "PosPerf2"
//Graph StratAvgA*-1 as "StratAvgA"
//once BestA = 300
//GRAPH BestA coloured (0,0,0) AS "BestA"
If StratAvgA >= StratAvgB Then
StratAvgB = StratAvgA //Update Best Strategy Profit
BestA = ValueX
EndIf
//once BestB = 300
//GRAPH BestB coloured (0,0,0) AS "BestB"
If WinCountA >= WinCountB Then
WinCountB = WinCountA  //Update Best Win Count
BestB = ValueX
EndIf

If WinCountA > WinCountB and StratAvgA > StratAvgB Then
Mode = 0
ElsIf WinCountA < WinCountB and StratAvgA < StratAvgB and Mode = 1 Then
ValueX = ValueX - (Increment*NIncPos)
NIncPos = NIncPos + 1
Mode = 2
ElsIf WinCountA >= WinCountB or StratAvgA >= StratAvgB and Mode = 1 Then
ValueX = ValueX + (Increment*PIncPos)
PIncPos = PIncPos + 1
Mode = 1
ElsIf WinCountA < WinCountB and StratAvgA < StratAvgB and Mode = 2 Then
ValueX = ValueX + (Increment*PIncPos)
PIncPos = PIncPos + 1
Mode = 1
ElsIf WinCountA >= WinCountB or StratAvgA >= StratAvgB and Mode = 2 Then
ValueX = ValueX - (Increment*NIncPos)
NIncPos = NIncPos + 1
Mode = 2
EndIf

If NIncPos > MaxIncrement or PIncPos > MaxIncrement Then
If BestA = BestB Then
ValueX = BestA
Else
If reps >= 10 Then
WeightedScore = 10
Else
WeightedScore = round((reps/100)*100)
EndIf
ValueX = round(((BestA*(20-WeightedScore)) + (BestB*WeightedScore))/20) //Lower Reps = Less weight assigned to Win%
EndIf
NIncPos = 1
PIncPos = 1
ElsIf ValueX > MaxValue Then
ValueX = MaxValue
ElsIf ValueX < MinValue Then
ValueX = MinValue
EndIF

Optimize = 0
EndIf

// Heuristics Algorithm 1 End

//ElsIf HeuristicsAlgo2 = 1 Then

//Heuristics Algorithm 2 Start

If (onmarket[1] = 1 and onmarket = 0) or (longonmarket[1] = 1 and longonmarket and countoflongshares < countoflongshares[1]) or (longonmarket[1] = 1 and longonmarket and countoflongshares > countoflongshares[1]) or (shortonmarket[1] = 1 and shortonmarket and countofshortshares < countofshortshares[1]) or (shortonmarket[1] = 1 and shortonmarket and countofshortshares > countofshortshares[1]) or (longonmarket[1] and shortonmarket) or (shortonmarket[1] and longonmarket) Then
optimize2 = optimize2 + 1
EndIf

If monthinit2 = 1 or monthinit2 = 3 or monthinit2 = 5 or monthinit2 = 7 or monthinit2 = 8 or monthinit2 = 10 or monthinit2 = 12 Then
MonthDays2 = 31
ElsIf monthinit2 = 4 or monthinit2 = 6 or monthinit2 = 9 or monthinit2 = 11 Then
MonthDays2 = 30
ElsIf monthinit2 = 2 Then
If (yearinit2/4 = round(yearinit2/4)) or (yearinit2/400 = round(yearinit2/400)) Then //haha not sure how exactly to do this
MonthDays2 = 29 //leap year
Else
MonthDays2 = 28
EndIf
EndIf

If (month = monthinit2 and day = dayinit2 + ResetPeriod2) or (month = monthinit2 + 1 and (day + (MonthDays2 - dayinit2)) >= ResetPeriod2) Then
ValueY = StartingValue2
WinCountB2 = 0
StratAvgB2 = 0
BestA2 = 0
BestB2 = 0
dayinit2 = day
monthinit2 = month
yearinit2 = year
EndIf

once ValueY = StartingValue2
once PIncPos2 = 1 //Positive Increment Position
once NIncPos2 = 1 //Neative Increment Position
once Optimize2 = 0 ////Initialize Heuristicks Engine Counter (Must be Incremented at Position Start or Exit)
once Mode2 = 1 //Switches between negative and positive increments
//once WinCountB2 = 3 //Initialize Best Win Count
//GRAPH WinCountB2 coloured (0,0,0) AS "WinCountB2"
//once StratAvgB2 = 4353 //Initialize Best Avg Strategy Profit
//GRAPH StratAvgB2 coloured (0,0,0) AS "StratAvgB2"

If Optimize2 = Reps2 Then
WinCountA2 = 0 //Initialize current Win Count
StratAvgA2 = 0 //Initialize current Avg Strategy Profit
HeuristicsCycle = HeuristicsCycle + 1

For i2 = 1 to Reps2 Do
If positionperf(i) > 0 Then
WinCountA2 = WinCountA2 + 1 //Increment Current WinCount
EndIf
//StratAvgA2 = StratAvgA2 + (((PositionPerf(i)*countofposition[i]*100000)*-1)*-1)
StratAvgA2 = StratAvgA2 + (((PositionPerf(i)*pointvalue)*countofposition[i])/pipsize)
Next
StratAvgA2 = StratAvgA2/Reps2 //Calculate Current Avg Strategy Profit
//Graph (PositionPerf(1)*countofposition[1]*100000)*-1 as "PosPerf1-2"
//Graph (PositionPerf(2)*countofposition[2]*100000)*-1 as "PosPerf2-2"
//Graph StratAvgA2*-1 as "StratAvgA2"
//once BestA2 = 300
//GRAPH BestA2 coloured (0,0,0) AS "BestA2"
If StratAvgA2 >= StratAvgB2 Then
StratAvgB2 = StratAvgA2 //Update Best Strategy Profit
BestA2 = ValueY
EndIf
//once BestB2 = 300
//GRAPH BestB2 coloured (0,0,0) AS "BestB2"
If WinCountA2 >= WinCountB2 Then
WinCountB2 = WinCountA2  //Update Best Win Count
BestB2 = ValueY
EndIf

If WinCountA2 > WinCountB2 and StratAvgA2 > StratAvgB2 Then
Mode = 0
ElsIf WinCountA2 < WinCountB2 and StratAvgA2 < StratAvgB2 and Mode2 = 1 Then
ValueY = ValueY - (Increment2*NIncPos2)
NIncPos2 = NIncPos2 + 1
Mode2 = 2
ElsIf WinCountA2 >= WinCountB2 or StratAvgA2 >= StratAvgB2 and Mode2 = 1 Then
ValueY = ValueY + (Increment2*PIncPos2)
PIncPos2 = PIncPos2 + 1
Mode = 1
ElsIf WinCountA2 < WinCountB2 and StratAvgA2 < StratAvgB2 and Mode2 = 2 Then
ValueY = ValueY + (Increment2*PIncPos2)
PIncPos2 = PIncPos2 + 1
Mode2 = 1
ElsIf WinCountA2 >= WinCountB2 or StratAvgA2 >= StratAvgB2 and Mode2 = 2 Then
ValueY = ValueY - (Increment2*NIncPos2)
NIncPos2 = NIncPos2 + 1
Mode2 = 2
EndIf

If NIncPos2 > MaxIncrement2 or PIncPos2 > MaxIncrement2 Then
If BestA2 = BestB2 Then
ValueY = BestA
Else
If reps2 >= 10 Then
WeightedScore2 = 10
Else
WeightedScore2 = round((reps2/100)*100)
EndIf
ValueY = round(((BestA2*(20-WeightedScore2)) + (BestB2*WeightedScore2))/20) //Lower Reps = Less weight assigned to Win%
EndIf
NIncPos2 = 1
PIncPos2 = 1
ElsIf ValueY > MaxValue2 Then
ValueY = MaxValue2
ElsIf ValueY < MinValue2 Then
ValueY = MinValue2
EndIF

Optimize2 = 0
EndIf

// Heuristics Algorithm 2 End

//EndIf

//c1=average[valuex](close)
//c2=average[valuey](close)

//
//condbuy =c1 crosses over c2 and rsi[14](close)<70
//condsell=c1 crosses under c2 and rsi[14](close)>30

//
//if condbuy then
//buy at market
//endif
//if condsell then
//sellshort at market
//endif

//pp=positionperf(0)*100

//if pp<-0.125 then
//sell at market
//exitshort at market
//endif

//set stop %loss 0.5 // exit sooner on performance criteria above
//set target %profit 0.25

graph valuex coloured(121,141,35,255)
graph valuey coloured(255,0,0,255)
//endif

indicator1 = ExponentialAverage[valuex](close)
indicator2 = ExponentialAverage[valuey](close)
c1 = (indicator1 CROSSES OVER indicator2)

indicator3 = WilderAverage[30](close)

c2 = (close > indicator3)

IF c1 AND c2 THEN
BUY 1 SHARES AT MARKET
ENDIF

// Conditions pour ouvrir une position en vente à découvert
indicator4 = ExponentialAverage[valuex](close)
indicator5 = ExponentialAverage[valuey](close)
c3 = (indicator4 CROSSES UNDER indicator5)

indicator6 = WilderAverage[30](close)
c4 = (close < indicator6)

IF c3 AND c4 THEN
SELLSHORT 1 SHARES AT MARKET
ENDIF

// Stops et objectifs
SET STOP pLOSS 8
SET TARGET pPROFIT 4
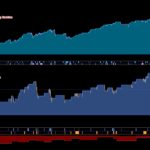
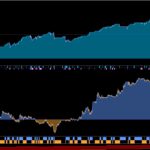
And I compare the results on 2 graph. But sadly the results are worst with the learning machine
Can you test too with this procedure (I think it’s good) on another simple code: Backtest to determine the “best” values to put in starting values and compare
May be it’s the code or me 🙂 but it’s strange the results are worst
See U Coders
For playing I do a new backtest with the Learing machine to optimize c and d
Results are better but without regularity (It remember me when I made tests on pyramid trading there some years)
See U
Baloney or interesting?
Paul that is interesting / good blue sky thinking!
If we are persevering with Renko, do we need to try and start the count for box size at the lowest low for x bars or highest high for x bars etc?
If the renko starts counting for box size near the top of a good run up and as the renko strategy allows for a count of 2 x box size before it goes Long … then we may be right near the highest high for x bars and bang we have gone long and just around the corner is a fib retrace coming along.
If we start counting near the lowest low for a Long then we are in with a fighting chance of going into early profit rather than early loss?
Given the limitations of Renko, we could try the ML on the good old Vectorial … I reckon still a good strategy and coming back into fashion now the madness / high volatility seems over for a while?
Renko was great when the ups and downs were long and frequent, but markets have quietened loads in the last 2 weeks?
Just a few thoughts anyway.
Paul thanked this postCan you test too with this procedure
I didn’t test but see below … your HAlgo2 is using values from HAlgo1 … see the red i’s well they should be i2?
It got screwed up so I made the i’s into iiiiiiii … cant stop sorry as a trade has just popped !!! 🙂
For i2 = 1 to Reps2 Do If positionperf iiiiii>(<strong>i</strong></span>) > 0 Then WinCountA2 = WinCountA2 + 1 //Increment Current WinCount EndIf //StratAvgA2 = StratAvgA2 + (((PositionPerfiiiiiiiii(<span style="color: #ff0000;" data-mce-style="color: #ff0000;">i</span>)*countofposition[<span style="color: #ff0000;" data-mce-style="color: #ff0000;">i]</span>*100000)*-1)*-1) StratAvgA2 = StratAvgA2 + (((PositionPerfiiiiiiiiii(<span style="color: #ff0000;" data-mce-style="color: #ff0000;">i</span>)*pointvalue)*countofposition[<span style="color: #ff0000;" data-mce-style="color: #ff0000;">i</span>])/pipsize) Next@GraHal Well both are interesting! With renko what you said about fib.retracement is spot on. Still it’s too early to give up on renko, especially with two boxsizes!
But I say, there’s a difference when to trade the dji. Focus on 8-15(30) to take trades and close at 17.30 or 18. Trading renko when the market is open, results go down. I’am still experimenting but that’s what it looks to me and you have stability with the spread. Also reducing the stoploss is key.
I’ve been running vectorial, optimised for 5s timeframe! Nice backtest, not so nice results live though. 🙂 Not even with ML included!
Probably I will give my idea from above a shot. Gathering parameters from optimisation results, group them and then use ML.
GraHal thanked this postCheers for the pointer, I knew those equity curves “on tbt” sometimes looked very improbable! I was actually thinking of experimenting with non ML Kase Dev Stops (posted earlier) or Kaufman’s Volatility Stops. This is totally needed now. Might even be worth setting the ML algo on them too (for a Renko ML2 boxsize and stop loss std deviation amount before the stop licks in or lookback period). I will post if I find anything that reliably improves profitability. I think Paul’s v4 Trailing Stop (TS) might offer a solution. I’m going to look at that version later.
With the myriad of opportunities for testing and not enough hours in the day, might be best to really hone in and use the most efficient and predictive indicators/chart patterns and ML those.
Still working on applying ML2 to Renko Boxsizes and the Take Profit amount… with soon to be added different stop losses, ha ha.Not sure yet if it’s best to keep it very simple with just a singe ML system or better to have two ML’s. Still working on that too.
At least v4 ts had this covered.
Paul this is next on my to do list, after clarifying if it’s better to have just an ML1 or an ML2 on the Ehler’s Oscillator, and on Renko’s.
Is the current definition of the Renko that we’ve been using the best definition or did you get better results with a switch between the 3 different types?GraHal thanked this postRe: Renko boxsize GraHal: ( ps/ why can’t I get this comment to say GraHal wrote: )
If we start counting near the lowest low for a Long then we are in with a fighting chance of going into early profit rather than early loss?
How trend dependent is the success of a Renko system if it still makes money in flat markets? Did you see that the Renko system still made profits in flat markets, I showed you how it made money in a flat period for the Dow in Nov 2016 (before the US election). The trailing stop was largish at 100 so the results are not to be totally dismissed like they should be if the stop is 10 ticks, now that we know the trailing stop doesn’t work with tbt testing. I actually can’t wait to open PRT and see how the Kase Dev Stop and Kaufman Volatility Stop fair.
Maybe Finning’s idea of an ATR related boxsize would work too? If somebody could get my code to work!? https://www.prorealcode.com/topic/machine-learning-in-proorder/page/19/#post-128100
Also note that to set starting values to the algorithm all the commented out code which have a ‘once’ as well as a ‘Graph’ command on the line directly below it has to be activated. i.e. once BestA = 300 etc.
I used it to graph and then set the final values generated by the algorithm as the starting values when using the strategy on a live system
Can you test too with this procedure
I didn’t test but see below … your HAlgo2 is using values from HAlgo1 … see the red i’s well they should be i2?
It got screwed up so I made the i’s into iiiiiiii … cant stop sorry as a trade has just popped !!! 🙂
1234567For i2 = 1 to Reps2 DoIf positionperf iiiiii>(<strong>i</strong></span>) > 0 ThenWinCountA2 = WinCountA2 + 1 //Increment Current WinCountEndIf//StratAvgA2 = StratAvgA2 + (((PositionPerfiiiiiiiii(<span style=”color: #ff0000;” data-mce-style=”color: #ff0000;”>i</span>)*countofposition[<span style=”color: #ff0000;” data-mce-style=”color: #ff0000;”>i]</span>*100000)*-1)*-1)StratAvgA2 = StratAvgA2 + (((PositionPerfiiiiiiiiii(<span style=“color: #ff0000;” data–mce–style=“color: #ff0000;”>i</span>)*pointvalue)*countofposition[<span style=“color: #ff0000;” data–mce–style=“color: #ff0000;”>i</span>])/pipsize)NextThanks Grahal,
I made the correction (as the rep was the same the results was the same)
And I compare your version on page 3, Paul version on pp 20 and Brad version on pp 22 and the results with the same value (4;30) and same code are quite different …
why can’t I get this comment to say GraHal wrote
Because you need to select the text you want to Quote THEN select the word Quote on the toolbar … see the red arrowhead on attached.
I’m glad that’s sorted, but no worries … we got there in the end!? 🙂 🙂
Bard thanked this post -
AuthorPosts
- You must be logged in to reply to this topic.
Machine Learning in ProOrder ProRealTime
ProOrder: Automated Strategies & Backtesting
Summary
This topic contains 454 replies,
has 32 voices, and was last updated by Khaled
4 years, 1 month ago.
Topic Details
| Forum: | ProOrder: Automated Strategies & Backtesting |
| Language: | English |
| Started: | 08/06/2017 |
| Status: | Active |
| Attachments: | 207 files |


About personal data collected
The information collected on this form is stored in a computer file by ProRealCode to create and access your ProRealCode profile. This data is kept in a secure database for the duration of the member's membership. They will be kept as long as you use our services and will be automatically deleted after 3 years of inactivity. Your personal data is used to create your private profile on ProRealCode. This data is maintained by SAS ProRealCode, 407 rue Freycinet, 59151 Arleux, France. If you subscribe to our newsletters, your email address is provided to our service provider "MailChimp" located in the United States, with whom we have signed a confidentiality agreement. This company is also compliant with the EU/Swiss Privacy Shield, and the GDPR. For any request for correction or deletion concerning your data, you can directly contact the ProRealCode team by email at privacy@prorealcode.com If you would like to lodge a complaint regarding the use of your personal data, you can contact your data protection supervisory authority.

