Hey guys,
I´ve created an algo that I´m pretty pleased with and I have made an indicator out of it.
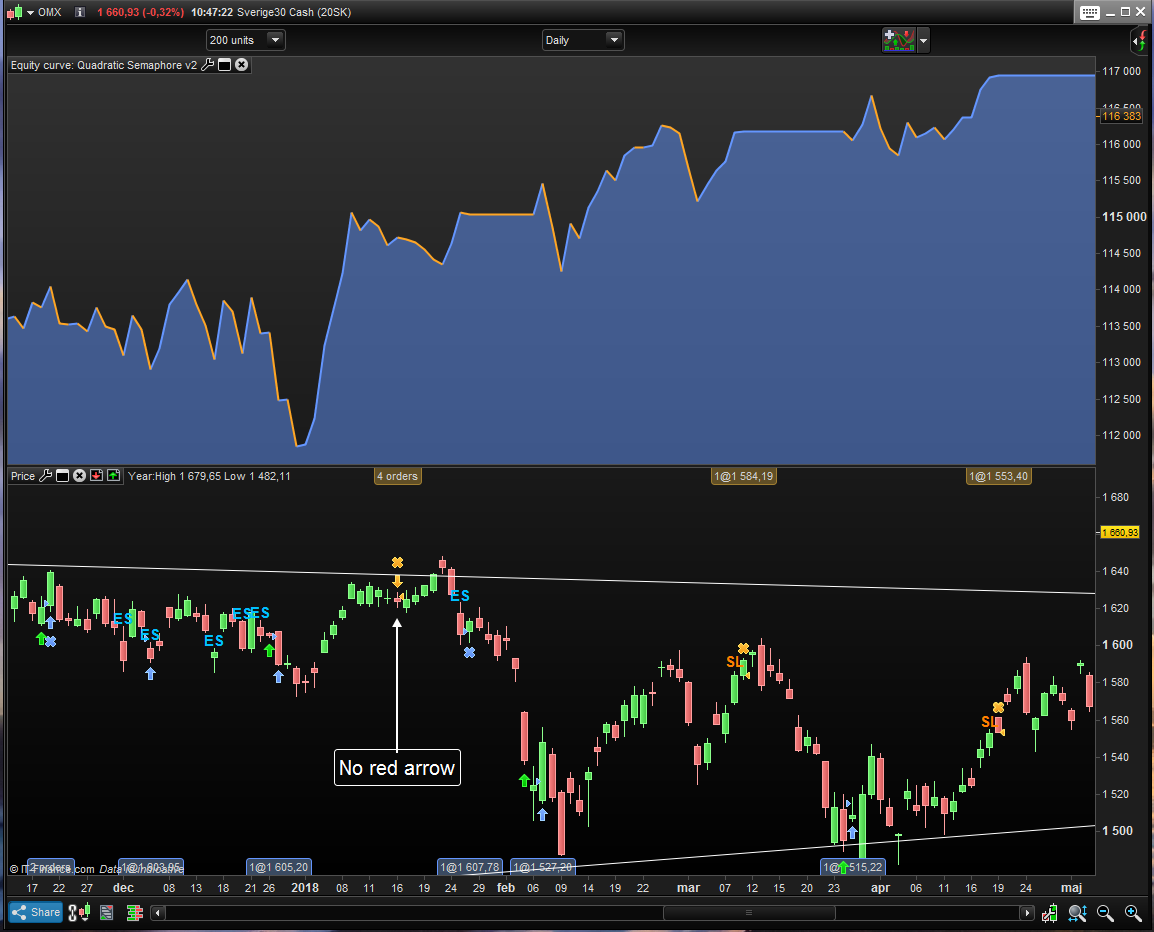
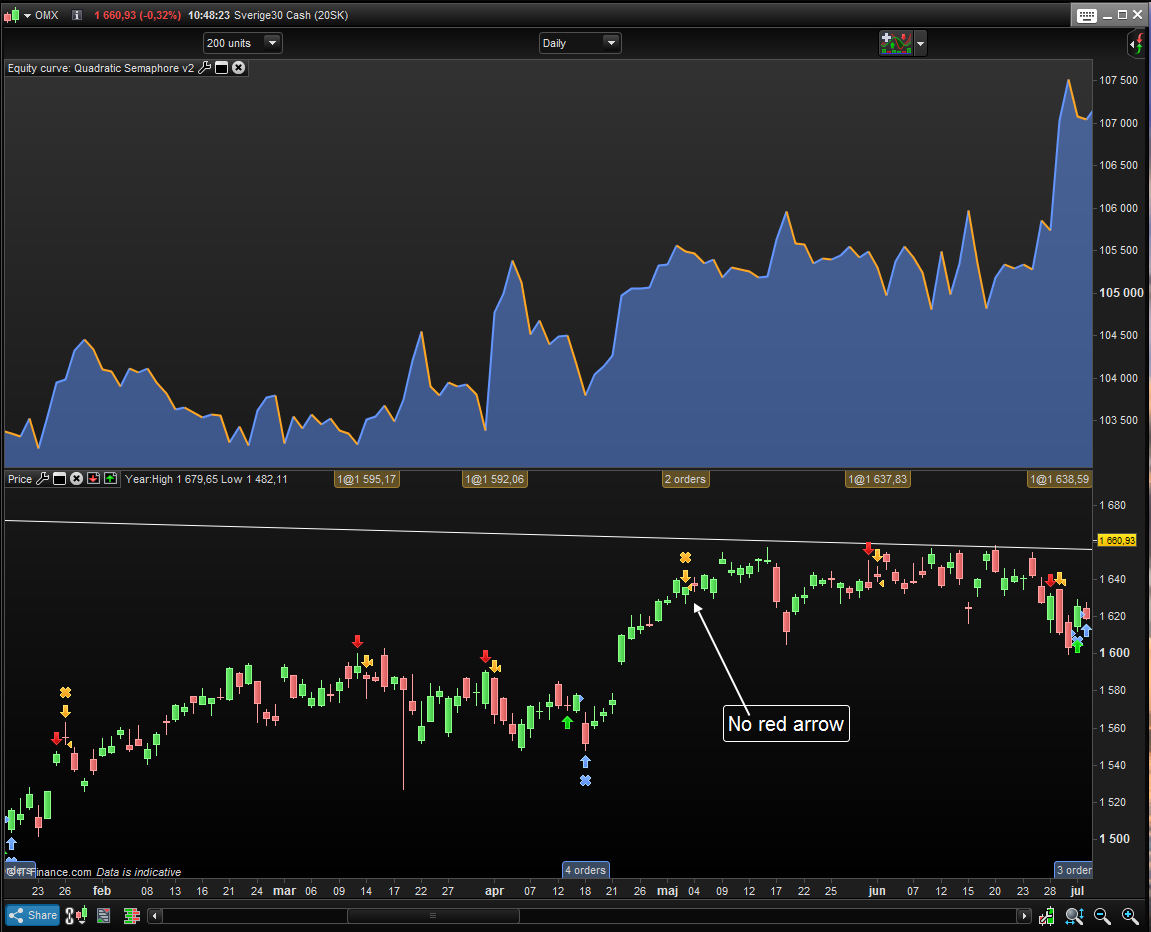
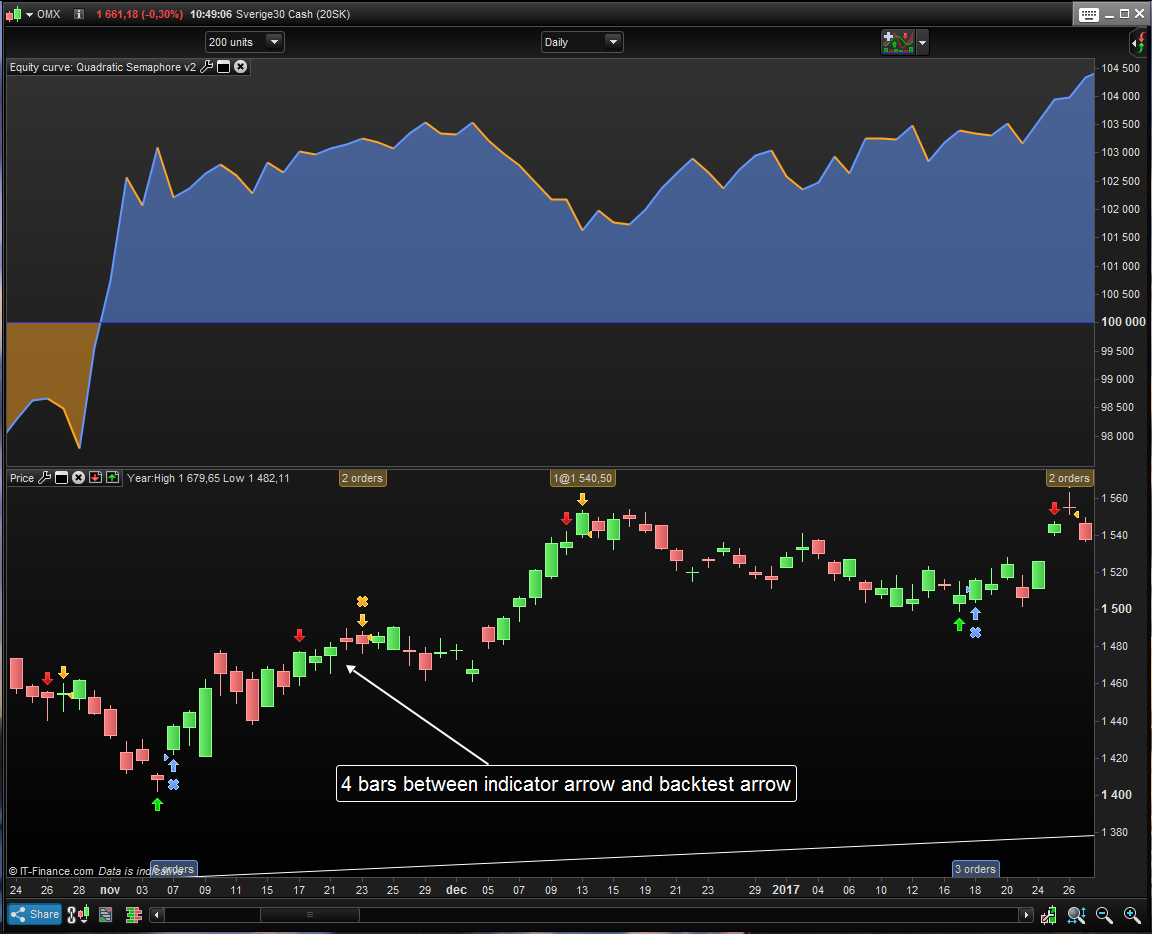
The only thing I´ve changed in the code when converting it into a indicator is replacing for exaple “buy” with “drawarrow up”, “sellshort” with “drawarrowdown” , nothing else in the code. But as you can see in my pictures the indicator dosen´t always do what the backtest is doing and in some places there´s up to four bars between when the indicator is showing where to take a position and where the backtest is taking it.
Do anyone have a clue about what the problem can be?
Only the complete code of both the Algo and the Indicator allows to replicate what you described.
The only thing I´ve changed
Have you also added / typed Return as the last line of the Algo turned into Indicator?
Post the code on here if you want and I’ll try it also?
ALGO


//            IQS-V1             //
//       SWING ALGO - OMX        //
//    CREATED BY JCAP 18.08.27    //
//    BASED ON https://www.prorealcode.com/prorealtime-indicators/quadratic-semaphore/   //


a=6
b=15
q=40
w=60
r=40
t=100
qq=340

length = a
p=b

x1 = barindex
x2 = square(x1)

y = high

S11 = summation[length](x2) - square(summation[length](x1))/length
S12 = summation[length](x1*x2) - (summation[length](x1) * summation[length](x2))/length
S22 = summation[length](square(x2)) - square(summation[length](x2))/length
Sy1 = summation[length](y*x1) - (summation[length](y)*summation[length](x1))/length
Sy2 = summation[length](y*x2) - (summation[length](y)*summation[length](x2))/length

max1 = average[length](x1)
max2 = average[length](x2)
may = average[length](y)
b2 = ((Sy1 * S22) - (Sy2*S12))/(S22*S11 - square(S12))
b3 = ((Sy2 * S11) - (Sy1 * S12))/(S22 * S11 - square(S12))
b1 = may - b2*max1 - b3*max2
qr = b1 + b2*x1 + b3*x2


yl = low

Sy1l = summation[length](yl*x1) - (summation[length](yl)*summation[length](x1))/length
Sy2l = summation[length](yl*x2) - (summation[length](yl)*summation[length](x2))/length

mayl = average[length](yl)
b2l = ((Sy1l * S22) - (Sy2l*S12))/(S22*S11 - square(S12))
b3l = ((Sy2l * S11) - (Sy1l * S12))/(S22 * S11 - square(S12))
b1l = mayl - b2l*max1 - b3l*max2
qrl = b1l + b2l*x1 + b3l*x2

period = round(p/2)+1
hh = qr[period]
ll = qrl[period]
countH = 0
countL = 0
for i = 1 to period-1 do
if qr[i]<hh then
countH=countH+1
endif
if qrl[i]>ll then
countL=countL+1
endif
next
for i = period+1 to p+1 do
if qr[i]<hh then
countH=countH+1
endif
if qrl[i]>ll then
countL=countL+1
endif
next


indicator1 = Average[q](close)
c1 = (close < indicator1)

indicator2 = Average[w](close)
c2 = (close > indicator2)

indicator3 = Average[r](close)
c3 = (close crosses over indicator3)

indicator4 = Average[t](close)
c4 = (close crosses under indicator4)

indicator5 = Average[qq](close)
c5 = (close < indicator5)

indicator6 = Average[qq](close)
c6 = (close > indicator6)


if countH=p and c1 then
buy 1 contract at market
endif


if c3 and c5 then
sell at market
endif

if  countL=p and c2 then
sellshort 1 contract at market
endif


if c4 and c6 then
exitshort at market
endif


INDICATOR

//            IQS-V1             //
//    SWING INDICATOR - OMX    //
//    CREATED BY JCAP 18.08.27    //
//BASED ON https://www.prorealcode.com/prorealtime-indicators/quadratic-semaphore/  //

a=6
b=15
//x=130
q=40
w=60
r=40//125//150
t=100
//u=4
//c=125
qq=340

length = a
p=b


x1 = barindex
x2 = square(x1)

y = high

S11 = summation[length](x2) - square(summation[length](x1))/length
S12 = summation[length](x1*x2) - (summation[length](x1) * summation[length](x2))/length
S22 = summation[length](square(x2)) - square(summation[length](x2))/length
Sy1 = summation[length](y*x1) - (summation[length](y)*summation[length](x1))/length
Sy2 = summation[length](y*x2) - (summation[length](y)*summation[length](x2))/length

max1 = average[length](x1)
max2 = average[length](x2)
may = average[length](y)
b2 = ((Sy1 * S22) - (Sy2*S12))/(S22*S11 - square(S12))
b3 = ((Sy2 * S11) - (Sy1 * S12))/(S22 * S11 - square(S12))
b1 = may - b2*max1 - b3*max2
qr = b1 + b2*x1 + b3*x2


yl = low

Sy1l = summation[length](yl*x1) - (summation[length](yl)*summation[length](x1))/length
Sy2l = summation[length](yl*x2) - (summation[length](yl)*summation[length](x2))/length

mayl = average[length](yl)
b2l = ((Sy1l * S22) - (Sy2l*S12))/(S22*S11 - square(S12))
b3l = ((Sy2l * S11) - (Sy1l * S12))/(S22 * S11 - square(S12))
b1l = mayl - b2l*max1 - b3l*max2
qrl = b1l + b2l*x1 + b3l*x2

period = round(p/2)+1
hh = qr[period]
ll = qrl[period]
countH = 0
countL = 0
for i = 1 to period-1 do
if qr[i]<hh then
countH=countH+1
endif
if qrl[i]>ll then
countL=countL+1
endif
next
for i = period+1 to p+1 do
if qr[i]<hh then
countH=countH+1
endif
if qrl[i]>ll then
countL=countL+1
endif
next


indicator1 = Average[q](close)
c1 = (close < indicator1)

indicator2 = Average[w](close)
c2 = (close > indicator2)

indicator3 = Average[r](close)
c3 = (close crosses over indicator3)

indicator4 = Average[t](close)
c4 = (close crosses under indicator4)

indicator5 = Average[qq](close)
c5 = (close < indicator5)

indicator6 = Average[qq](close)
c6 = (close > indicator6)


atr = averagetruerange[length]


if countH=p and c1 then

DRAWARROWUP(barindex,low-atr/4) coloured(0,200,0)
endif


if c3 and c5 then
drawtext("SL",barindex[0],high+atr/4,dialog,bold,15) coloured(255,128,0)
endif

if  countL=p and c2 then
DRAWARROWDOWN(barindex[0],high+atr/4) coloured(200,0,0)
endif


if c4 and c6 then

drawtext("ES",barindex[0],high+atr/4,dialog,bold,15) coloured(0,191,255)
endif


return
I´m running the code/indicator on Sweden 30 OMX daily (it´s the same issue on other markets and timeframe).
Indicator works on my Platform, unless I have misunderstood the Issue?
More later … Grandkids hogging my computer! 🙂
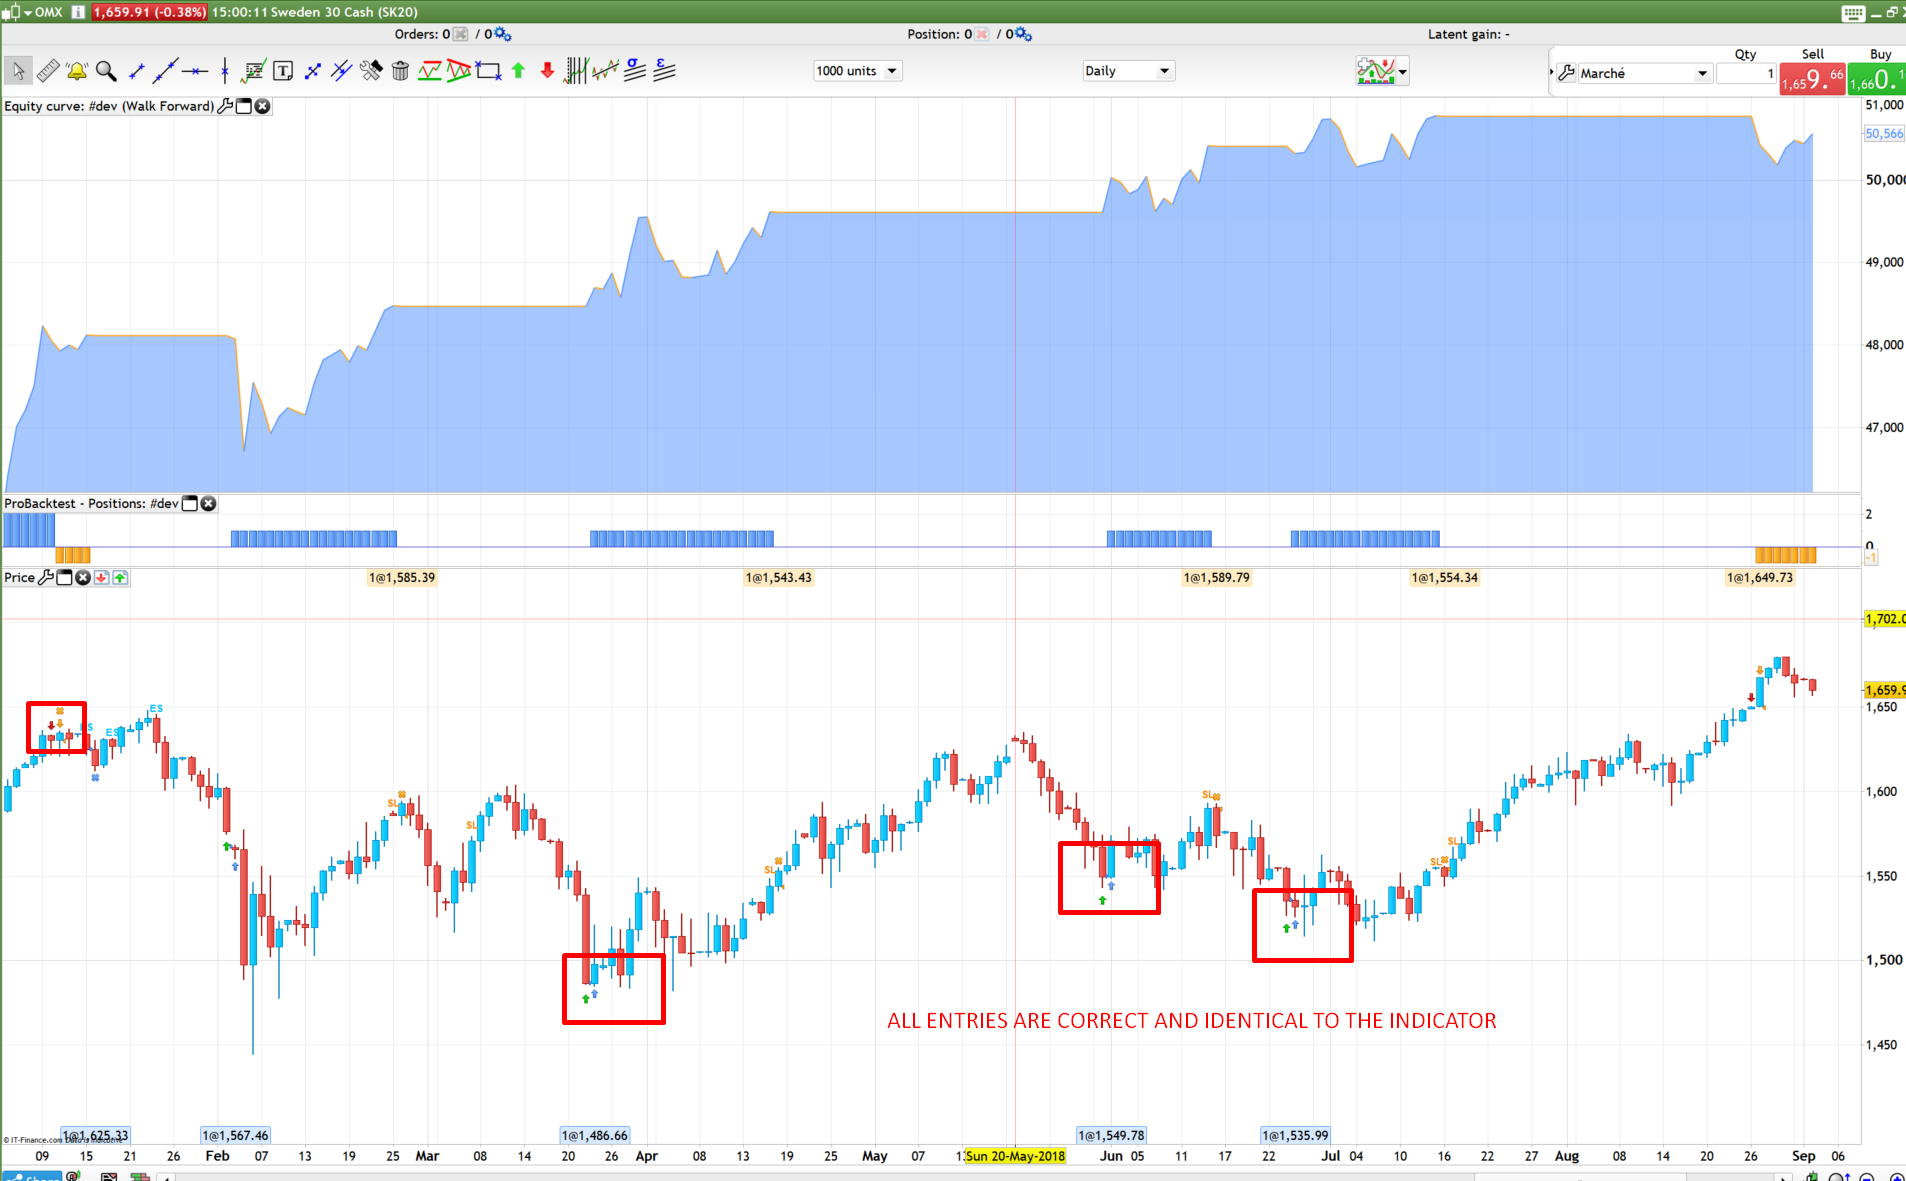
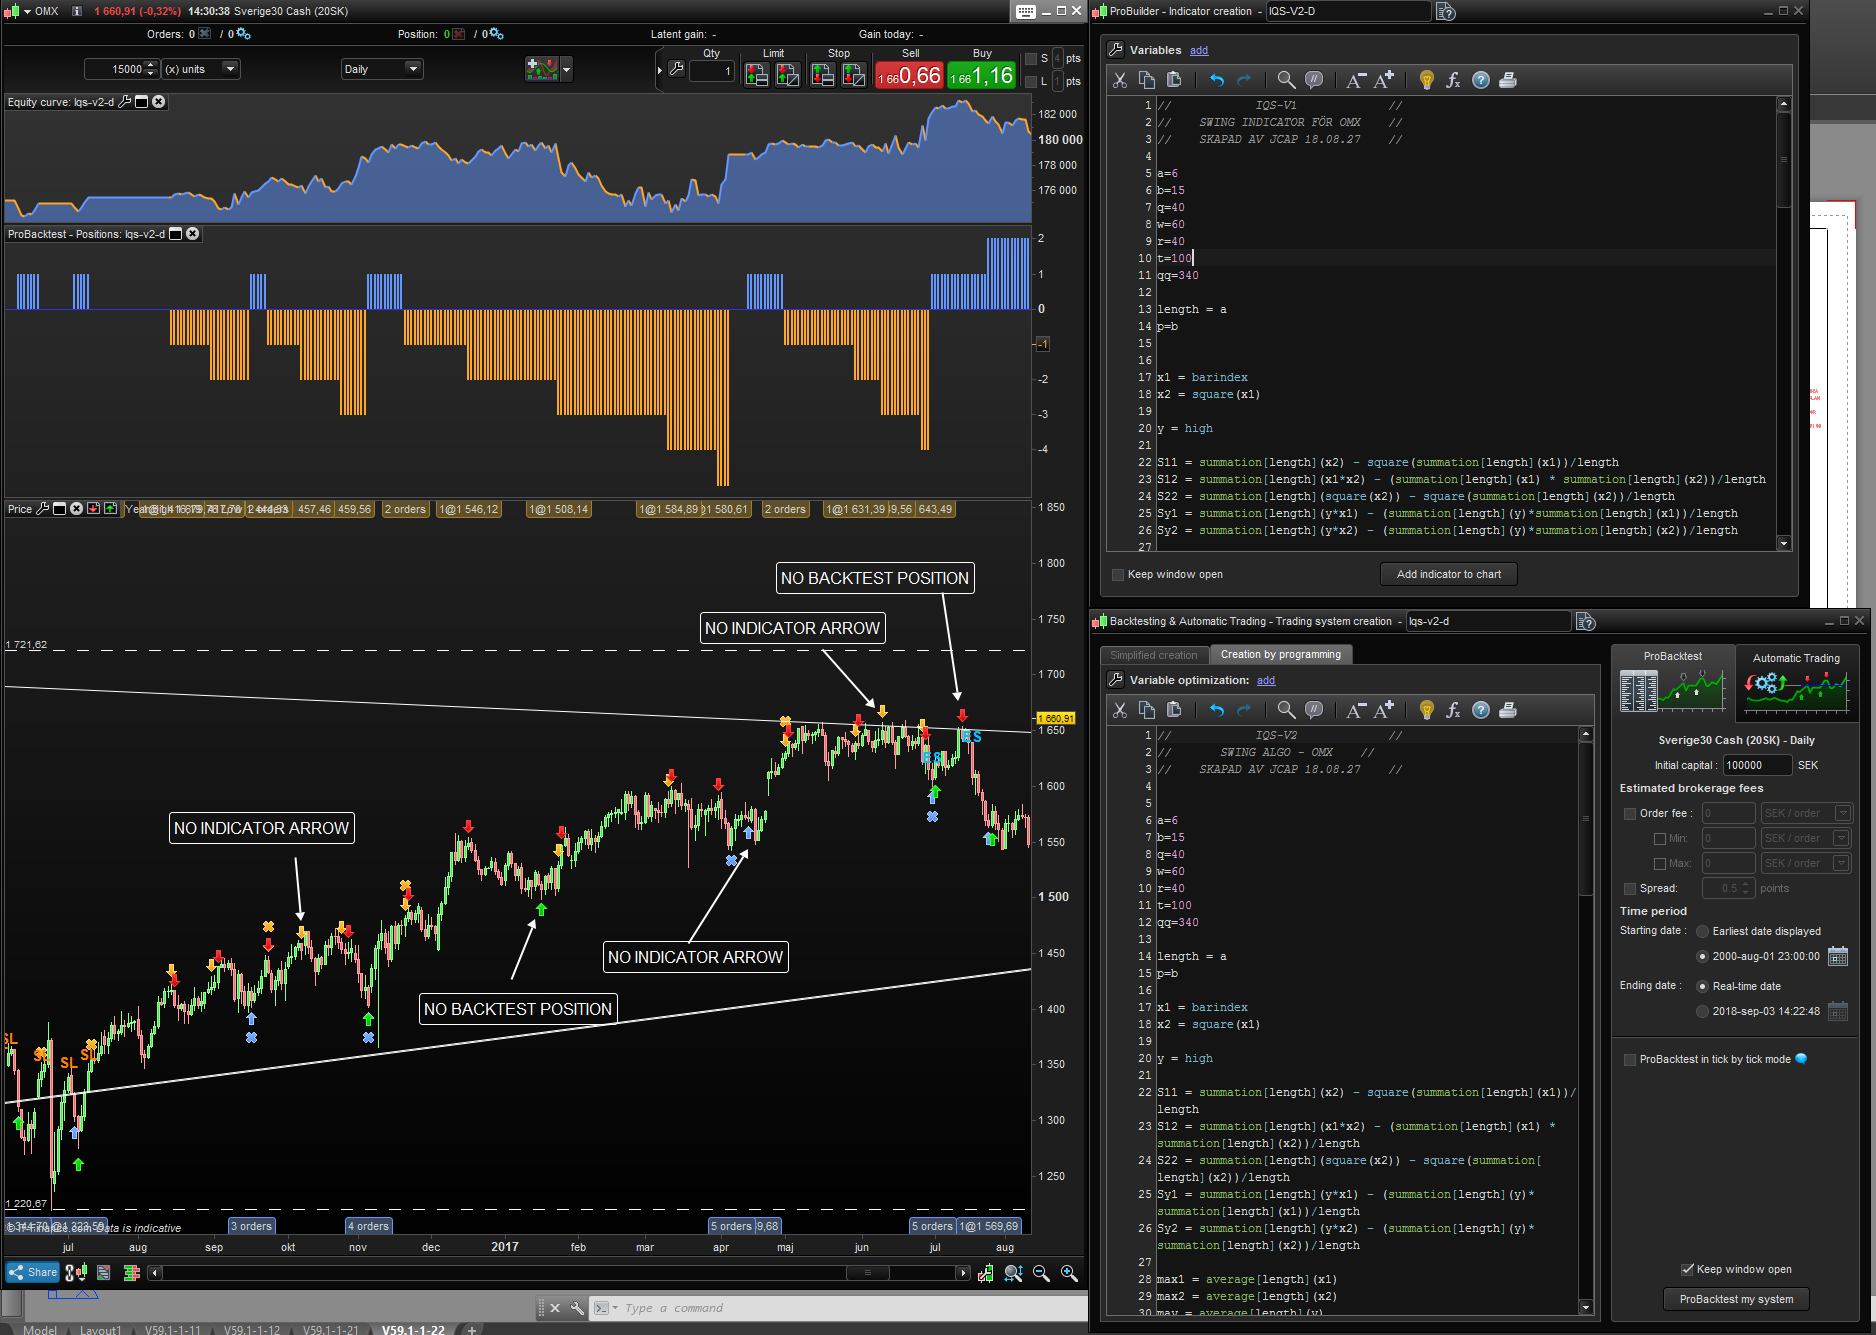
Look at my pictures.
Run the backtest and you can see that there´s inconsistencies between the backtest and indicator. Indicator shows positions that the backtest dosen´t take and the other way around. There´s also some large gaps between indicator positions and backtest positions.
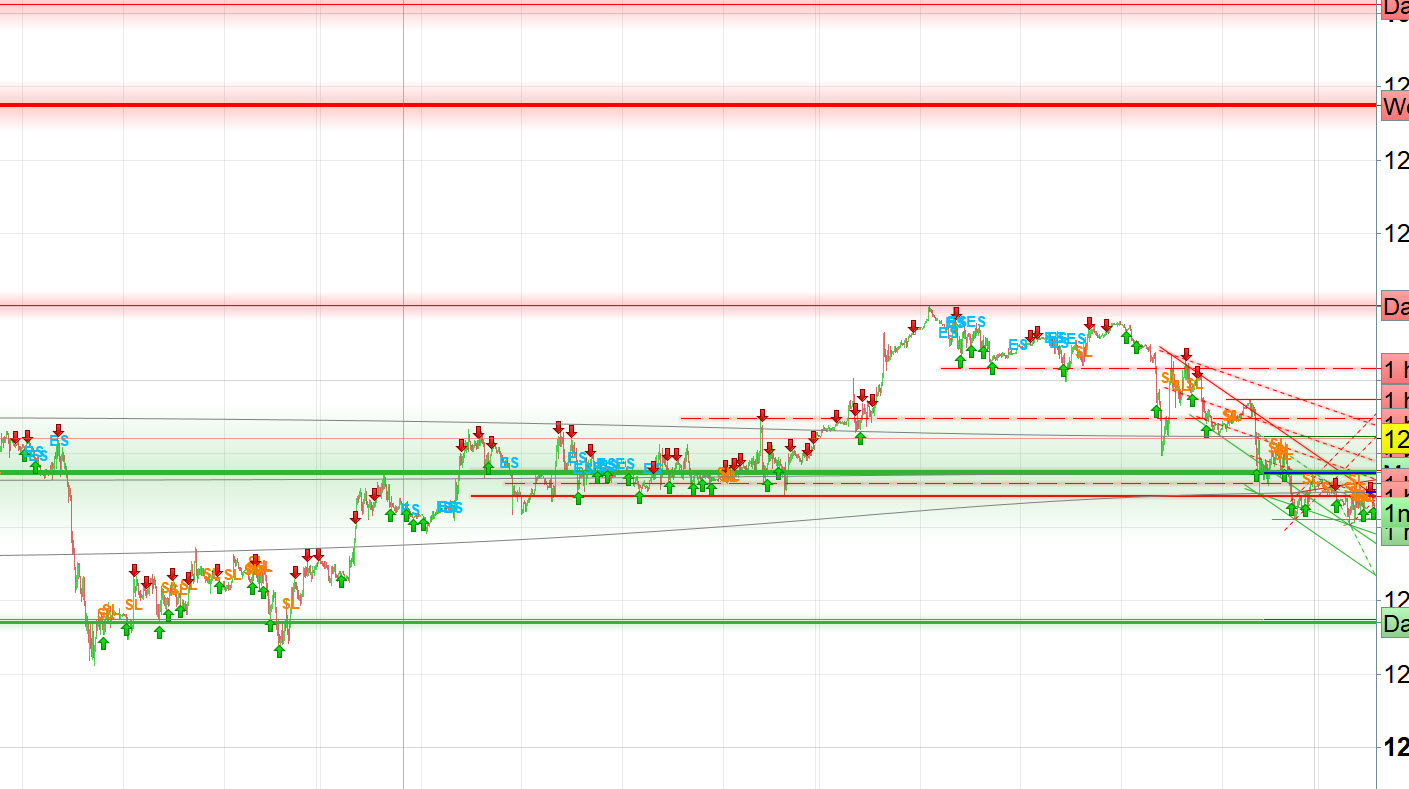
I think that your indicator and your strategy does not share the same settings because all is correct in my own tests (picture attached). Please double check the variables a,b,w, etc. and if they have the same values.
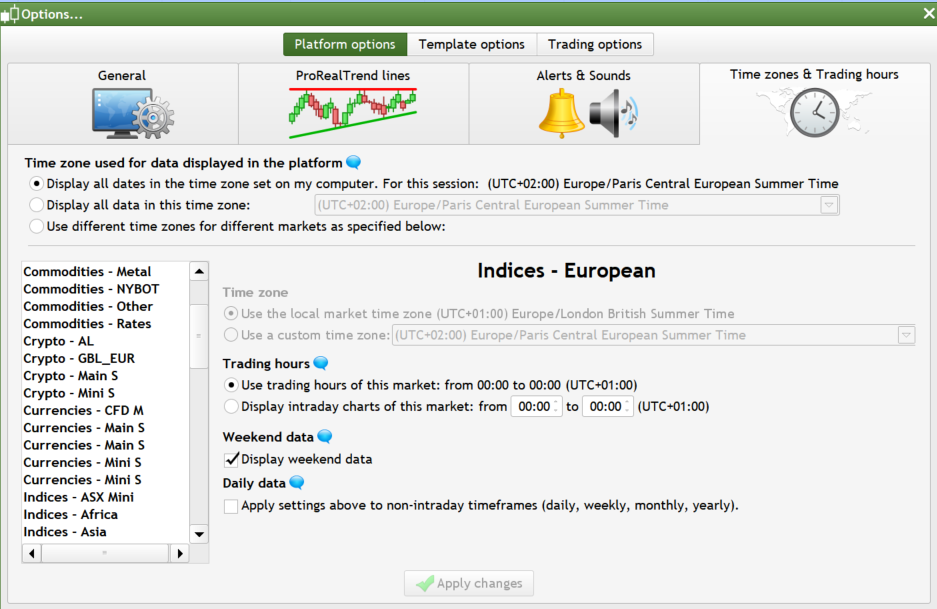
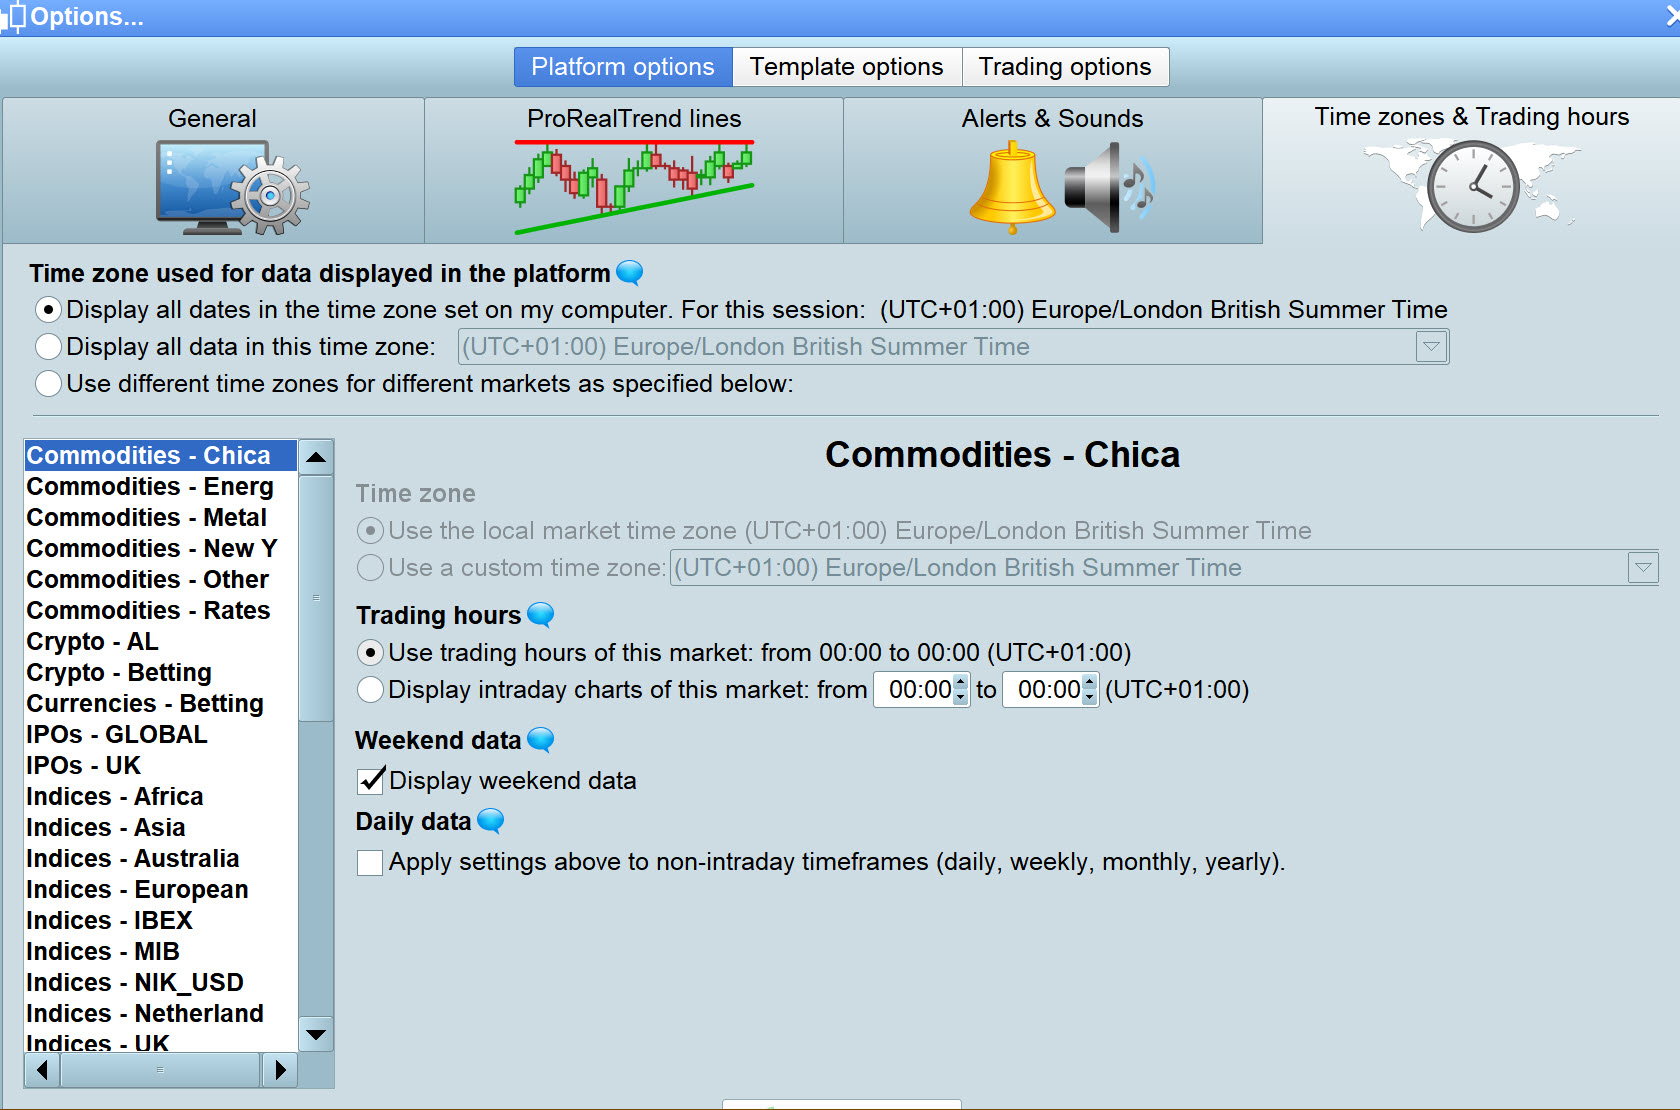
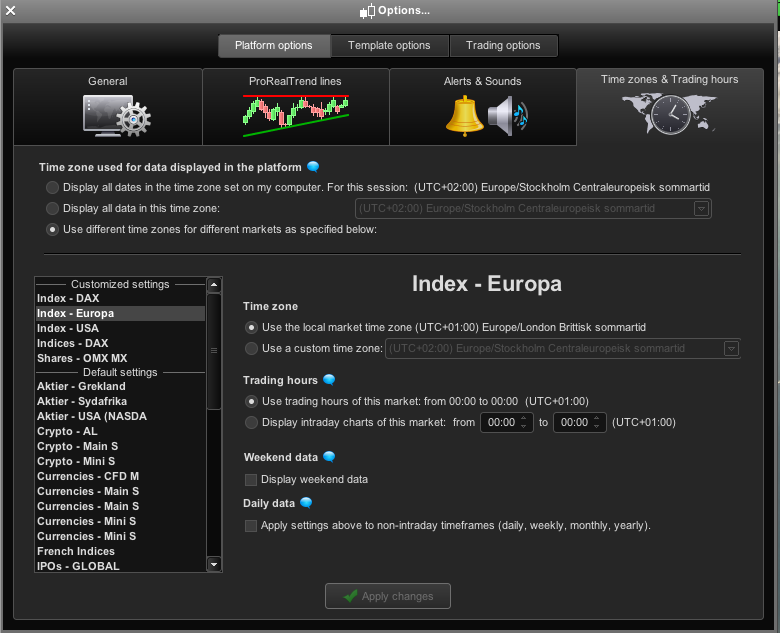
I have the same settings in the backtest and indicator. Right now i have the timesettings at 00:00-00:00 and it get´s even worse if I change it to the real trading hours for omx (09:00-17:30).
Hmmmm .. everything’s working perfectly for me.. please compare your time settings (right click on the price chart and choose ‘custom trading hours’).
Are you with IG? Real or demo account?
Could someone help us with a backtest?
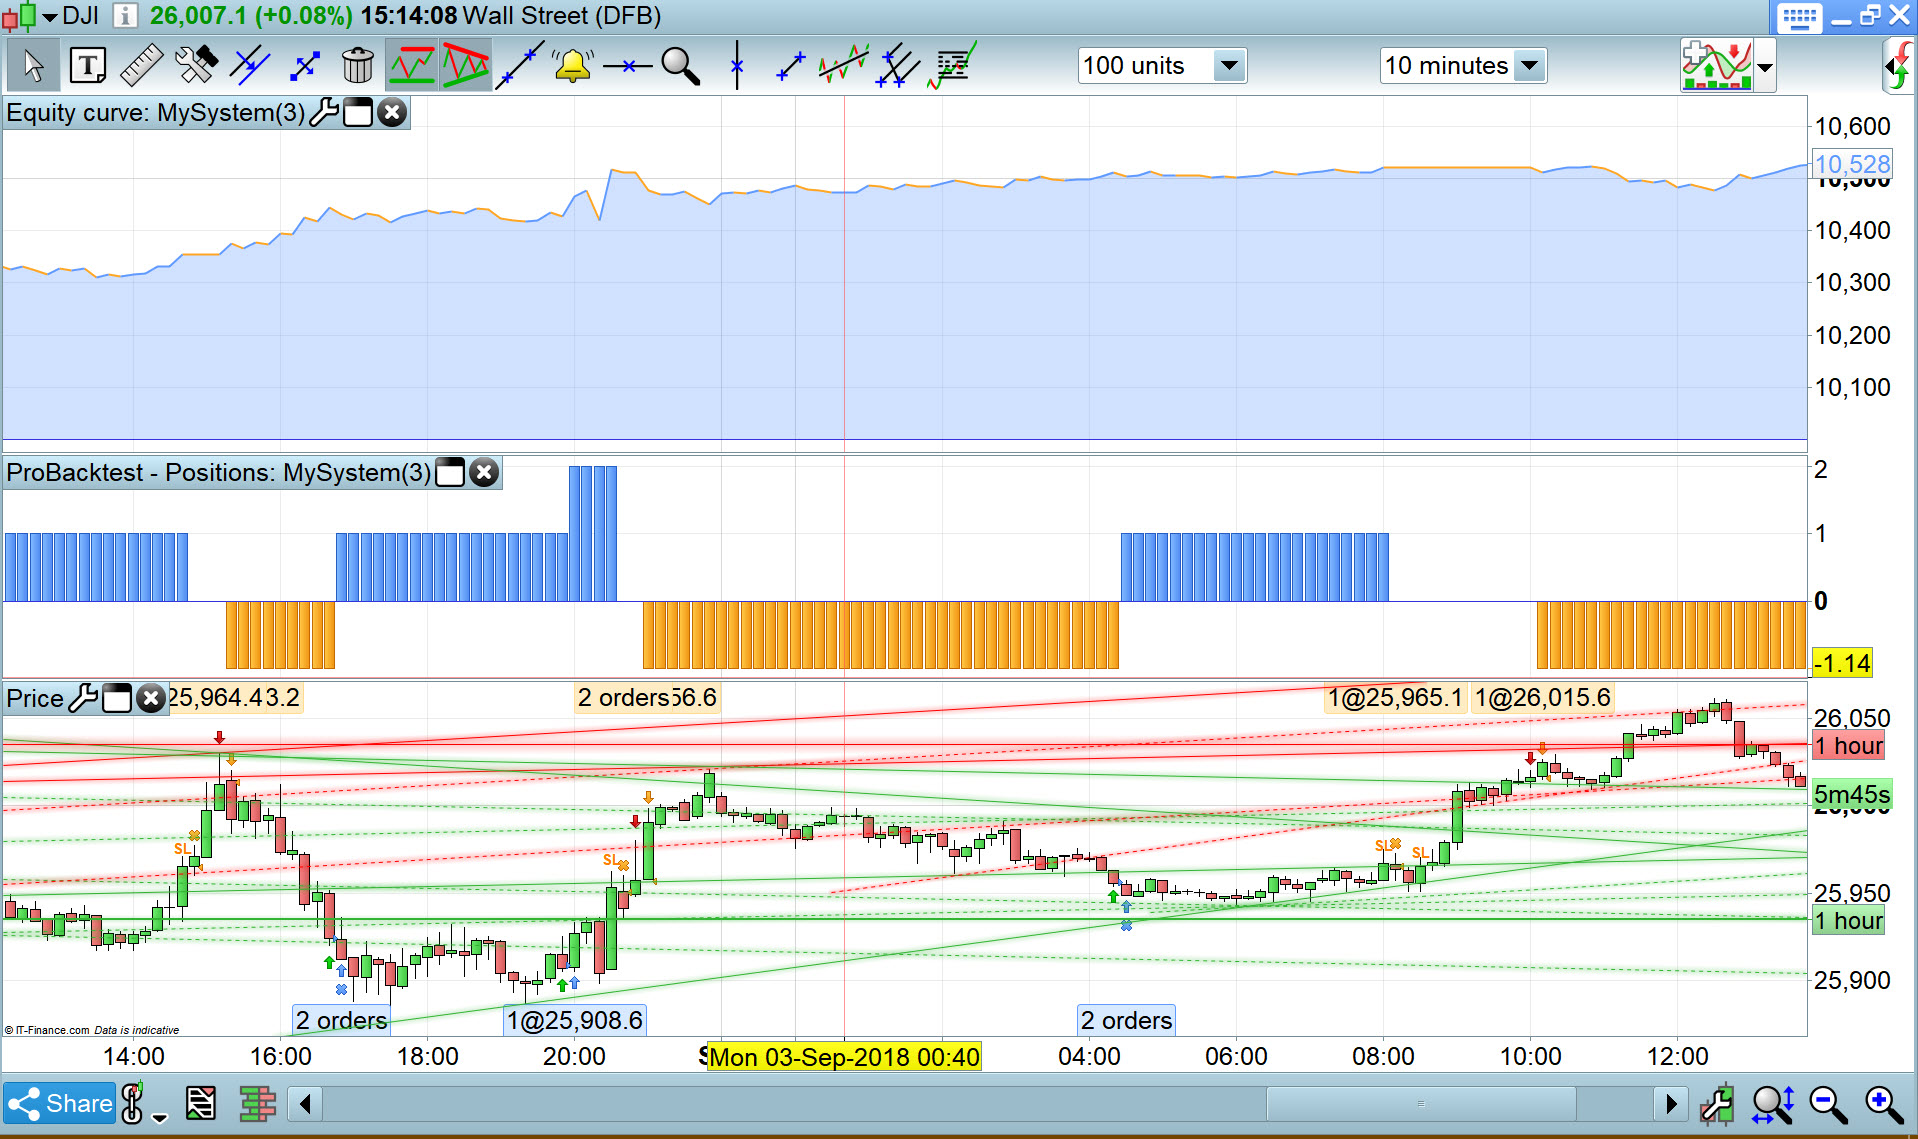
Sorry I can’t get chance to read the full story (Grandkids) , but does attached help?
Thank you GraHal, your backtest match perfectly the indicator, just like me. I’m still struggling to find what is the problem with J_Capitale account..
Thanks for your answers. I´m with IG on a demo account with real time data.
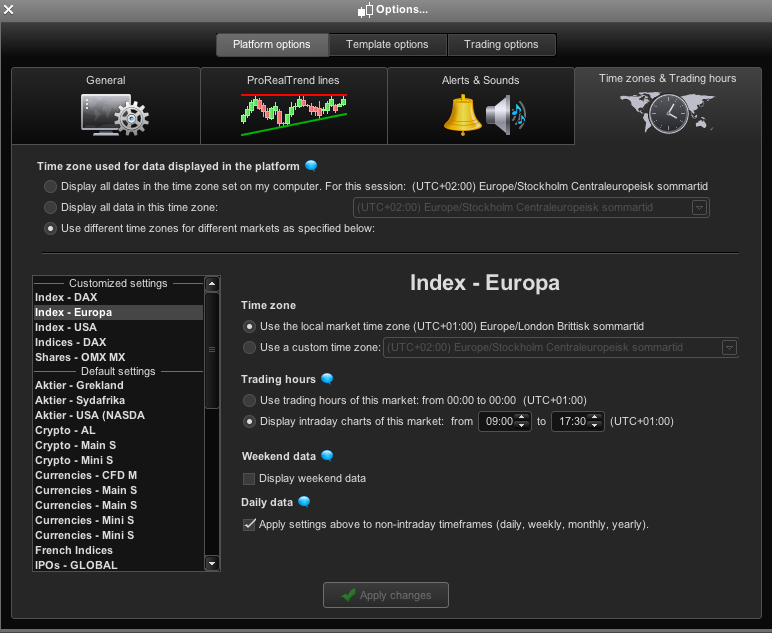
I´ve added pictures the timesettings that I´ve used when posting pictures here (00:00-00:00) and the timesettings that I want to use (09:00-17:30, no weekend data, apply settings to non intraday).
Sorry for double posting but I tried to add the “weekend data” and now everything works.
But why is it like this? If I change the timesettings, isn´t the backtest on the new settings then? I just want real data, not IG data…
You can change the settings you like, but candles keep being built on real incoming data by IG, so you won’t see weekend data, but those data are still used to calculate indicators.
I know this because I used to hide weekend data myself and backtests were different from what I could see on the screen.
Oh that´s just shit. I want to be able to trade this strategy outside of IG because tax regulations.
But I guess that I can trade after the strategy (algo) tho it seemes to care about my timesettings, I will have a one or two days delay but it´s better than nothing I guess. Thanks for your answers.