REM --------------------------
REM PRC_multiperiods HeatMap indicator
REM --------------------------
startperiod=  8     // start period of the loop
maxPeriod=   48     // end period of the loop
Step=         4     // period step of the loop
Period= startperiod //first period to test is startperiod

while Period <= maxPeriod do
mean, fractionUp, fractionDn = CALL "MarketMode"[Period]
PosH= mean/(fractionUp-0)
PosL= mean/(0-fractionDn)
Ro = max(0, (50-PosH*150))
Ge = max(0, (50+PosL*150))
drawtext("■",barindex,Period,dialog,bold,18) coloured(min(ro,255),min(ge,255),0)

Period= max(startperiod, Period+Step) //increase indicator period for next loop iteration

wend

return mean style(line,3) as "MarketMode", fractionUp coloured(100,100,100) as "upper line", fractionDn coloured(100,100,100) as "lower line", 8, 48
REM --------------------------
REM Market Mode indicator
REM --------------------------

Variable: Period 20

IF barindex >= Period THEN
REM ----------------------
REM BANDPASS FILTER, Code 5.1 from Cycle Analytics for Traders by John F.Ehlers 2013
REM ----------------------
REM High Pass Filter
HPPrice= MedianPrice
HPPeriod= Period             // 20
HPBandwidth= 0.5             // 0.10-0.50
alphaHP= (COS(0.25*HPBandwidth*360/HPPeriod) + SIN(0.25*HPBandwidth*360/HPPeriod)-1) / COS(0.25*HPBandwidth*360/HPPeriod)
HP= (1+alphaHP/2) * (HPPrice-HPPrice[1]) + (1-alphaHP)*HP[1]

REM BandPass Filter
BPPrice= HP
BPPeriod= HPPeriod            // 20
BPBandwidth= HPBandwidth      // 0.10-0.50
beta= COS(360/BPPeriod)
gamma= 1/COS(360*BPBandwidth/BPPeriod)    // 2013 => 360, 2008 =>720
alphaBP= gamma - SQRT(gamma*gamma-1)
BP= 0.5*(1-alphaBP)*(BPPrice-BPPrice[2]) + beta*(1+alphaBP)*BP[1] - alphaBP*BP[2]


REM --------------------------
REM Market Mode
REM --------------------------
mean=    BP
dPeriod= Period * 2         // (40)
FOR k= 1 to dPeriod-1 DO
mean= mean + BP[k]
inc= k
NEXT

mean= mean/inc
LevelUpDownAveragePeriod= MAX(8, Period /2)   // (10)
alphaUpDown= 2 /(1+LevelUpDownAveragePeriod)
workapeak=   workapeak[1]
IF mean > 0 THEN
workapeak= workapeak[1] + alphaUpDown*(mean-workapeak[1])
ENDIF
workavaley= workavaley[1]
IF mean < 0 THEN
workavaley= workavaley[1] + alphaUpDown*(mean-workavaley[1])
ENDIF

REM Colour of the BP Line
Fraction = 0.8
fractionUp= Fraction*workapeak
fractionDn= Fraction*workavaley
IF mean > fractionUp THEN
r= 50
g= 205
b= 50
ELSIF mean < fractionDn THEN
r= 255
g= 50
b= 50
ELSE
r= 205
g= 205
b= 0
ENDIF

REM Colour of the BP Histogramm
iPeriod1= 0
PosH= mean/(fractionUp-0)
PosL= mean/(0-fractionDn)
Ro = max(0, (50-PosH*150))
Ge = max(0, (50+PosL*150))
drawtext("■",barindex,iperiod1,dialog,bold,18) coloured(min(ro,255),min(ge,255),0)
ENDIF

endif

return mean coloured(r,g,b) style(line,3) as "MarketMode", fractionUp coloured(100,100,100) as "fractionUp", fractionDn coloured(100,100,100) as "fractionDn"
Hallo all,
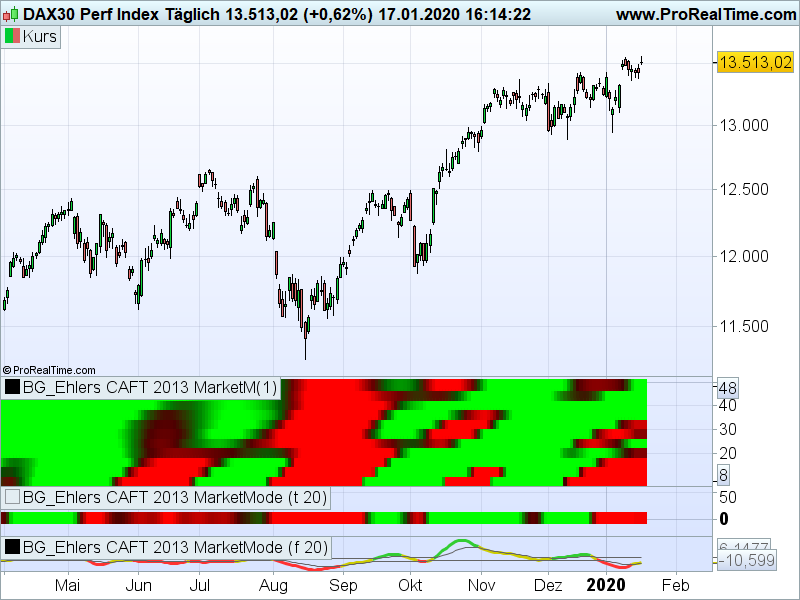
the attached picture is showing the market mode
- Market mode heat map Period of 8 to 48
- Market mode at fix period of 20
- Market mode Bandpass Filter
By comparing the fix period (20) to the heat map at line of period 20 you will see a difference.
What is this difference caused by?
Do you have any idea to fix it?
Many thanks for your reply in advanced.
Best regards
Hasardeur