Hello people,
can someone convert this indicator in ProRealCode? I’m having difficulties in translating the median price calculation, but maybe i’m missing something easy here.
Link of the article and how to use this indicator here: http://www.financial-hacker.com/the-market-meanness-index/
var MMI(var *Data,int Length)
{
var m = Median(Data,Length);
int i, nh=0, nl=0;
for(i=1; i<Length; i++) {
if(Data[i] > m && Data[i] > Data[i-1])
nl++;
else if(Data[i] < m && Data[i] < Data[i-1])
nh++;
}
return 100.*(nl+nh)/(Length-1);
}
Thanks.
Best regards.
This code is from Zorro platform. Do you have documentation of how the Median() function is calculated? It should help a lot 🙂
Nicolas,
I found this one in tradingview:
//@version=2
study(“MMI-Price Changes”)
// Set Inputs
inputLength=input(300)
topband=input(76)
bottomband=input(74)
// Get Average Price Change
mean(price1, price2, length) =>
sum = 0
for i = 0 to length
if price1[i] – price2[i] > 0
sum := sum + (price1[i] – price2[i])
else
sum := sum + (price2[i] – price1[i])
sum / length
// Market Meaness Index Function
MMI(price1,price2, length) =>
m = mean(open,close,inputLength)
nh = 0
nl = 0
for i = 1 to length
if price1[i] – price2[i] > 0
if (price1[i] – price2[i]) > m
if (price1[i] – price2[i]) > (price1[i+1] – price2[i+1])
nl := nl + 1
else
if (price2[i] – price1[i]) < m
if (price2[i] – price1[i]) < (price2[i+1] – price1[i+1])
nh := nh + 1
100 – 100*(nl + nh)/(length – 1)
u=plot(topband)
l=plot(bottomband)
t=plot(90)
b=plot(60)
fill(u,l,black)
fill(t,u,yellow)
fill(b,l,blue)
plot(MMI(open,close,inputLength))
Pietro,
try to see if this code produces the same results of the code you wanted:
length=300

rangeday=open-close
a=abs(rangeday)
m=summation[length](a)/length

if rangeday>0 and rangeday>rangeday[1] and rangeday>m then
b=1
else
b=0
endif
if rangeday>0 and rangeday<rangeday[1] and rangeday<m then
b=1
endif

c=summation[length](b)

ret=100 - 100*(c)/(length - 1)
return ret
Hello guys,
sorry for late response, but i forgot to subscribe the thread 🙂
Yes Nicolas, the code is from Zorro, but i did not find anything more in their forum sadly.
Thanks Gabri for the code, i will try it asap.
Hi Gabri,
i’ve tried the code, there’s something that is not working.
The indicator value should be between 0 and 100, because the idea is that if the value > 75 there’s no trend, below 75 is trending.
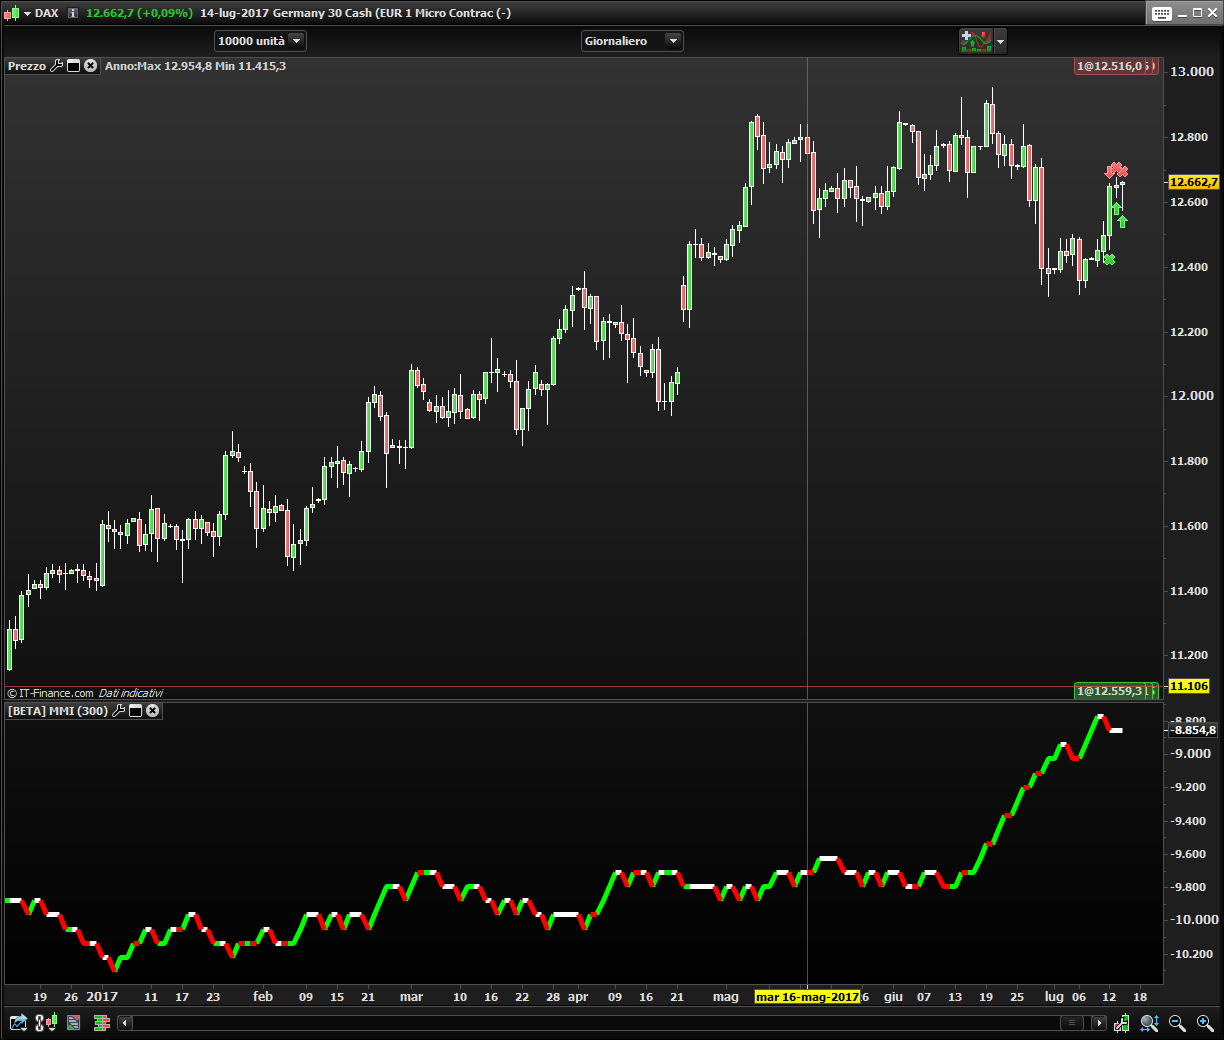
See the attached image, DAX daily, we have negative value for the indicator, -8000 etc.
It seems that the second part of the formula ret=100 – 100*(c)/(length – 1) is producing a value far high than 100, it should be <= 100.
In particulare, variable C have value of 25000 or more on this instruments. So the problem should rely on the variable C in my opinion, but i don’t found why.
Pietro,
this is what I get with a daily DAX (10000 units):
The highest value I got for c is 175 (once) other than that it never went above 100. I saw you called the code [beta]MMI, maybe you changed some line inadvertently.
Hi Gabri,
you are right, your code is ok, but i’ve only added a colouring logic and put the length in a variable, the code is this:
//length=300

rangeday=open-close
a=abs(rangeday)
m=summation[length](a)/length

if rangeday>0 and rangeday>rangeday[1] and rangeday>m then
b=1
else
b=0
endif
if rangeday>0 and rangeday<rangeday[1] and rangeday<m then
b=1
endif

c=summation[length](b)

MMI = 100 - 100*(c)/(length - 1)

IF MMI > MMI[1] THEN
R = 0
G = 255
B = 0
ENDIF

IF MMI < MMI[1] THEN
R = 255
G = 0
B = 0
ENDIF

IF MMI = MMI[1] THEN
R = 255
G = 255
B = 255
ENDIF

RETURN MMI COLOURED(R,G,B) AS "MMI"
By the way, since i want to use the MMI in automated strategy, i will leave it plain for now and see if we got some performance improvement in trend following strategy.
Many thanks.
Regards.
Prova a modificare le seguenti righe cosi:
IF MMI > MMI[1] THEN
Red = 0
Green = 255
Blue = 0
ENDIF

IF MMI < MMI[1] THEN
Red = 255
Green = 0
Blue = 0
ENDIF

IF MMI = MMI[1] THEN
Red = 255
Green = 255
Blue = 255
ENDIF

RETURN MMI COLOURED(Red,Green,Blue) AS "MMI"
Funziona, mi sono accorto di aver utilizzato la variabile B per due cose differenti, credo fosse quello l’errore giusto?
Si, capita spesso non preoccuparti 🙂
Does it working as expected please Pietro?
Hi Nicolas,
to be honest i still can’t say if this is working as expected, since i can’t test the original code from jcl that is in a C variant.
Said that, the code from Gabri seems to produce a reasonable result. I’ve read that jcl smooth the MMI indicator before use it in strategy, look here: http://www.financial-hacker.com/boosting-systems-by-trade-filtering/
So i’ve smoothed it with Supersmoother (taken from the thread you make), but maybe a low pass filter can be used, it seems that jcl used a low pass filter, but since he recall a function i can’t say what’s inside.
This is the code for the smoother MMI that i’ve made:
length=300

rangeday=open-close
a=abs(rangeday)
m=summation[length](a)/length

if rangeday>0 and rangeday>rangeday[1] and rangeday>m then
b=1
else
b=0
endif
if rangeday>0 and rangeday<rangeday[1] and rangeday<m then
b=1
endif

c=summation[length](b)

ret=100 - 100*(c)/(length - 1)


Period = 10
Data = ret
PI = 3.14159
f = (1.414*PI) / Period
a = exp(-f)
c2 = 2*a*cos(f)
c3 = -a*a
c1 = 1 - c2 - c3
if barindex>length then
S = c1*(Data[0]+Data[1])*0.5 + c2*S[1] + c3*S[2]
endif
return S
Another things that i can’t reproduce is the Peak and Valley function, it should be something related to high and low of the period.
In the linked article jcl seems to not consider the value higher or lower 75, but if MMI is lowering or raising. In particular he used the Falling function: DoTrade = falling(MMI_Smooth)
So i suppose that if the MMI is lowering the price should be trending. I’ve made some raw test that did not give good result, but i don’t have a solid automated trend following system, it would be good to use this as a filter to a solid trend following system to see if it can improve it.
I will report the result of further investigation.
Regard.
From what I saw I am not sure you can use this indicator like trigger. I believe is more like a trend defining tool (like an adx)