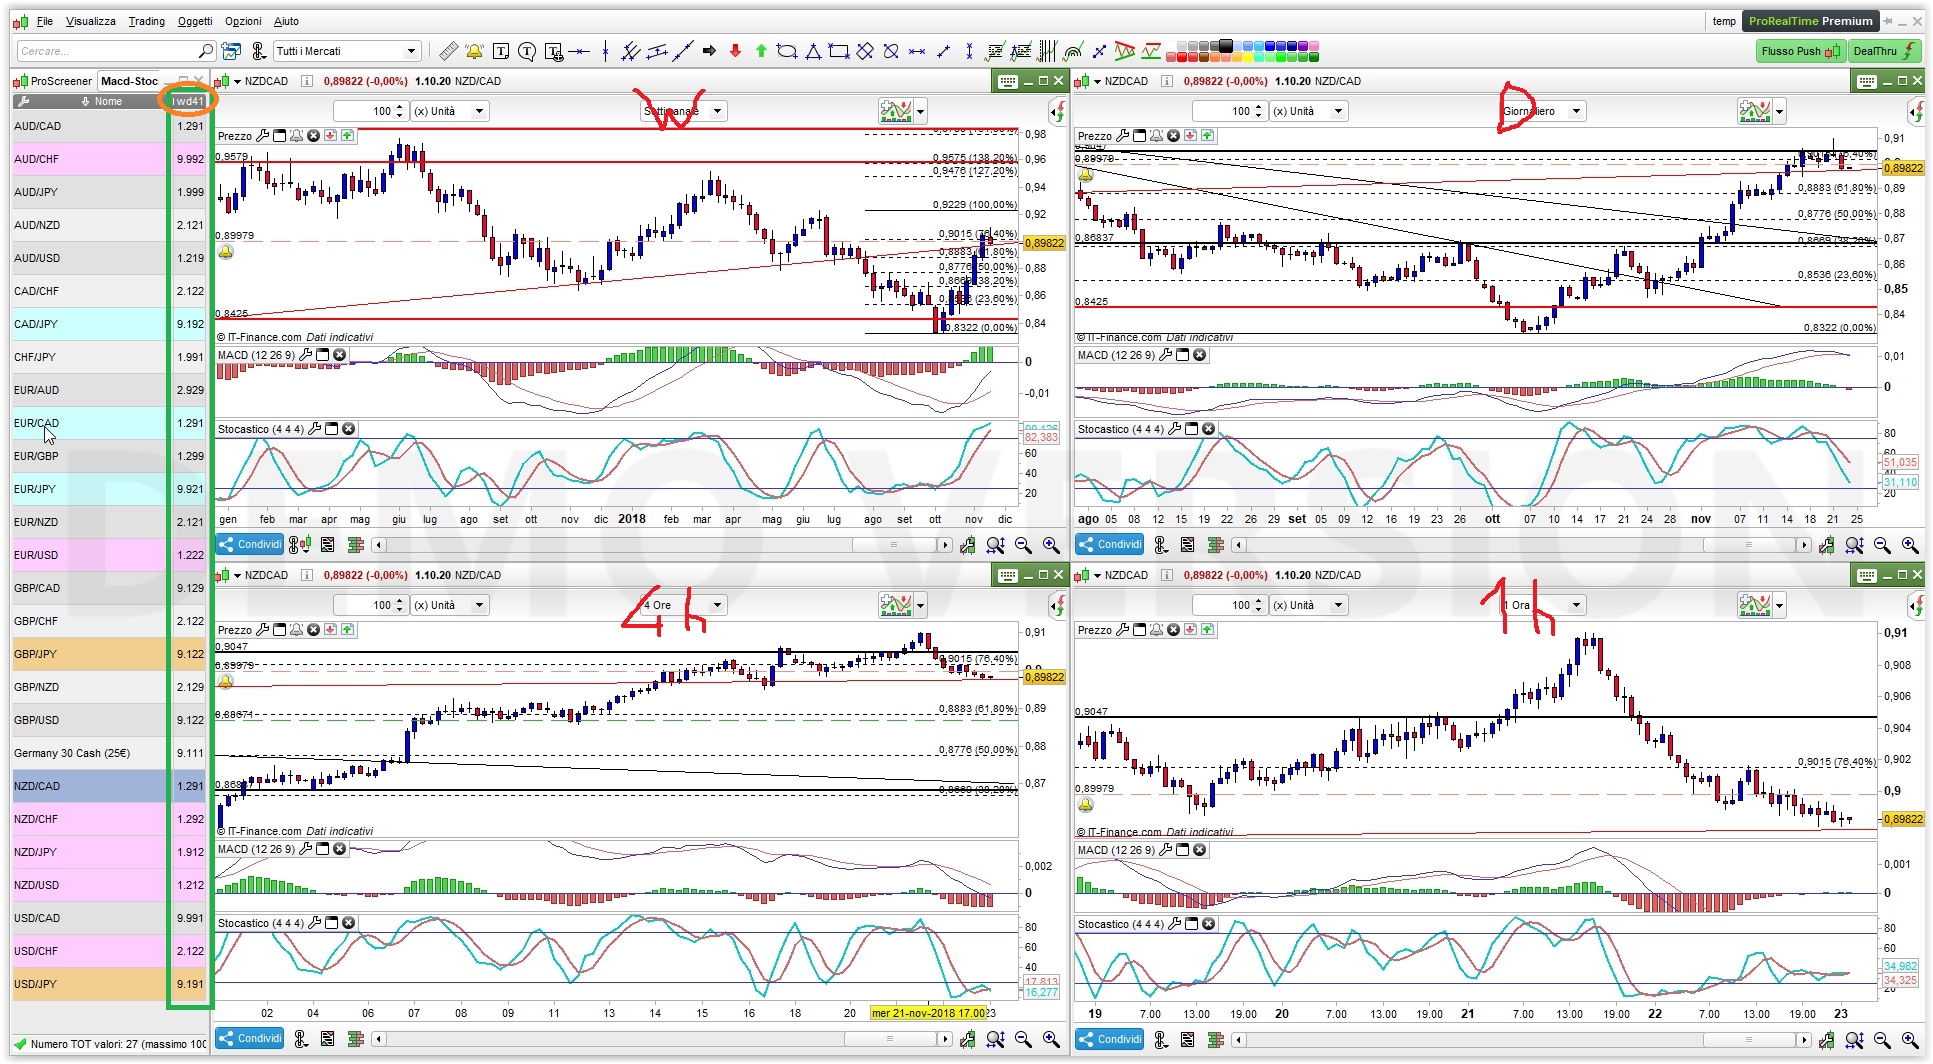
Hi, I need a screener that has to meet just 2 criteria on the same chart ( MACD and Stochastic) but I need to screen for this setup so it will show an individual setup on a Weekly, Daily, 4 Hour and 1 Hour – buy or sells. Ideally to appear all in the one screener box so I can recognise each timeframe etc.
Can this be easily done and how can it be built?
Thanks in advance
Dave
There you go:
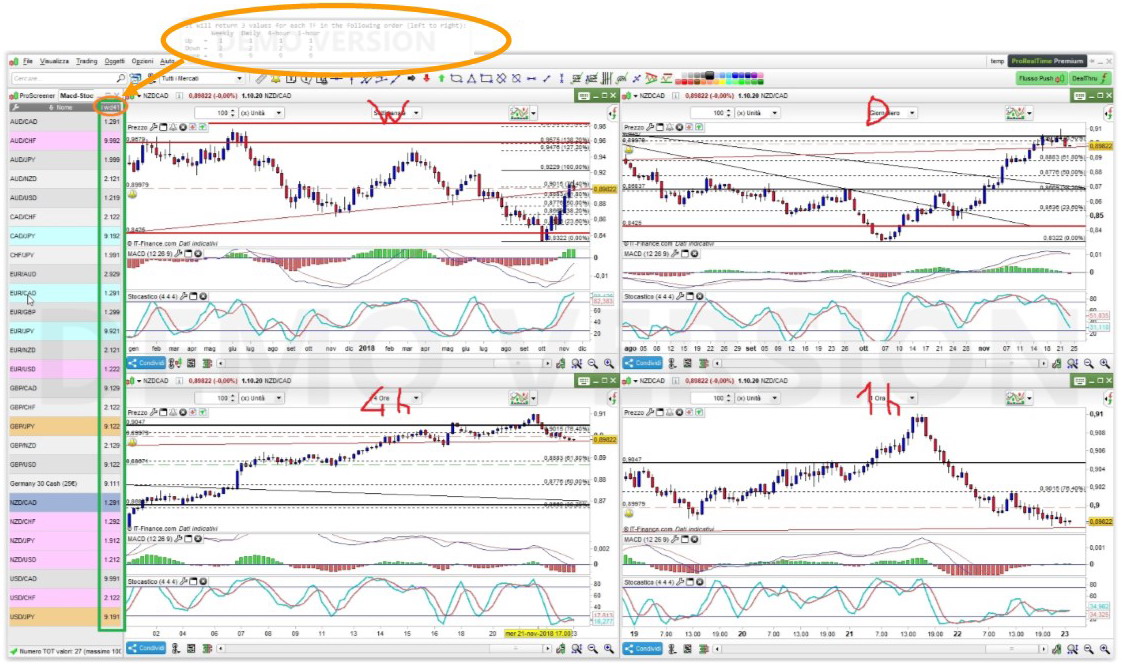
// It will return 3 values for each TF in the following order (left to right):
//        Weekly  Daily  4-hour  1-hour
// Up   =   1       1       1       1
// Down =   2       2       2       2
// none =   9       9       9       9
//
// Constants    (can be used throughout TF's with the same name)
Stoc1   = 4              //4
Stoc2   = 4              //4
Stoc3   = 4              //4
Macd1   = 12             //12
Macd2   = 26             //26
Macd3   = 9              //9
// Variables
// to use different names for each TF, I appended each one a letter:
//     W = weekly TF
//     D = Daily  TF
//     4 = 4-hour TF
//     1 = 1-hour TF
//
TIMEFRAME(Weekly)
StocKW   = Stochastic[Stoc1,Stoc2](close)
StocDW   = Average[Stoc3](StocKW)
StocUPW  = StocKW > StocDW
StocDNW  = StocKW < StocDW
MacdValW = MACD[Macd1,Macd2,Macd3](close)
MacdUPW  = MacdValW > MacdValW[1]
MacdDNW  = MacdValW < MacdValW[1]
IF StocUPW AND MacdUPW THEN
   xW   = 1000
ELSIF StocDNW AND MacdDNW THEN
   xW   = 2000
ELSE
   xW   = 9000
ENDIF
//
TIMEFRAME(Daily)
StocKD   = Stochastic[Stoc1,Stoc2](close)
StocDD   = Average[Stoc3](StocKD)
StocUPD  = StocKD > StocDD
StocDND  = StocKD < StocDD
MacdValD = MACD[Macd1,Macd2,Macd3](close)
MacdUPD  = MacdValD > MacdValD[1]
MacdDND  = MacdValD < MacdValD[1]
IF StocUPD AND MacdUPD THEN
   xD   = 100
ELSIF StocDND AND MacdDND THEN
   xD   = 200
ELSE
   xD   = 900
ENDIF
//
TIMEFRAME(4 hours)
StocK4   = Stochastic[Stoc1,Stoc2](close)
StocD4   = Average[Stoc3](StocK4)
StocUP4  = StocK4 > StocD4
StocDN4  = StocK4 < StocD4
MacdVal4 = MACD[Macd1,Macd2,Macd3](close)
MacdUP4  = MacdVal4 > MacdVal4[1]
MacdDN4  = MacdVal4 < MacdVal4[1]
IF StocUP4 AND MacdUP4 THEN
   x4   = 10
ELSIF StocDN4 AND MacdDN4 THEN
   x4   = 20
ELSE
   x4   = 90
ENDIF
//
TIMEFRAME(1 hour)
StocK1   = Stochastic[Stoc1,Stoc2](close)
StocD1   = Average[Stoc3](StocK1)
StocUP1  = StocK1 > StocD1
StocDN1  = StocK1 < StocD1
MacdVal1 = MACD[Macd1,Macd2,Macd3](close)
MacdUP1  = MacdVal1 > MacdVal1[1]
MacdDN1  = MacdVal1 < MacdVal1[1]
IF StocUP1 AND MacdUP1 THEN
   x1   = 1
ELSIF StocDN1 AND MacdDN1 THEN
   x1   = 2
ELSE
   x1   = 9
ENDIF
//
TIMEFRAME(DEFAULT)
Result = xW + xD + x4 + x1
IF Result = 9999 THEN
   Result = 0
ENDIF
SCREENER[Result] (Result AS "wd41")
It just checks if both Macd and Stochastic are going Upwards or Downwards for each TF.
Other conditions can be easily added.
Hello, I really apologise for not being clearer. It’s sometimes hard to explain.
I have the formula already to give me my live signals of buys or sells ( see below)
Each signal is relevant on it’s own separate time frame. For example if my MACD and Stochastic settings line up just on the 1 hour I want to see it
showing on the screener. They do not cross reference with another timeframe.
I just need them to display when they set up, but to show an individual setup on w, d, 4hr 1 hr ( and buy or sell if possible) all within the one screener window
that I can recognise.
Can you kindly re- do the multi timeframe formula with my better explanation of what I need?
This is my 2 indicator set up trigger point…First one is a Buy reversal signal and the bottom one is Sell reversal.
indicator1 = Average[1](Stochastic[3,1](close))
c1 = (indicator1 CROSSES UNDER 22)

indicator2 = MACDline[8,26,9](close)
c2 = (indicator2 > 0)
--------------------------------------------

indicator1 = Average[1](Stochastic[3,1](close))
c1 = (indicator1 CROSSES OVER 78)

indicator2 = MACDline[8,26,9](close)
c2 = (indicator2 < 0)
There are 3 ways to make a screener:
- single TF (if you need this, it’s the simplest one), then you can make as many copies as you want and launch all of them using different windows
- multiple TF’s in one window with each TF independent of the other ones (the one I made above)
- multiple TF’s in one window with each TF dependent from the other ones, the result will be true if conditions will be met in ALL TF’s
Screeners allow ONE window, with ONE list and ONE criterion.
Multiple copies of the same screeners, after duplicating them with different names, may be launched at the same time on any TF, even the same one, in separate windows.
Do you have any pic of what you want to see on your screen?
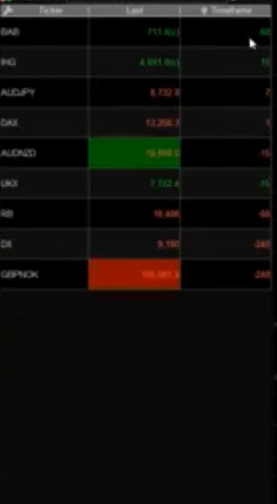
Hi, here is a real example some other company that has done exactly this multi timeframe in 1 screeners window.
It basically has the numbers to represent the time frame within the same window that has triggered the signal on the right side column. ‘5’ for 5 min, ’15’ for 15 min, ’60’ for 60 min, ‘240’ for 4 hours, ‘1’ = 1 day and ‘7’ = 1 week. Also the numbers are either red or green for showing if buy or sell although this is less important to me.
Does that make sense for you to copy and create?
Failing this I think your option2 is the closest that can work if the above cannot be done somehow.( each signal needs to be independent on each timeframe)
Thanks very much.
Your image was not taken from data shown by ProScreener, I think. What if your conditions were true in more than one TF, for example on a 4-hour TF and 1-hour TF, do they sum minutes 240+60=300? In such a case how can you teel when 300 is the some of two TF’s or a 5-hour TF by itself?
I will rewrite my code to accomodate your indicators:
// It will return 3 values for each TF in the following order (left to right):
//        Weekly  Daily  4-hour  1-hour
// Up   =   1       1       1       1
// Down =   2       2       2       2
// none =   9       9       9       9
//
// Variables
// to use different names for each TF, I appended each one a letter:
//     W = weekly TF
//     D = Daily  TF
//     4 = 4-hour TF
//     1 = 1-hour TF
//
TIMEFRAME(Weekly)
indicator1W = Average[1](Stochastic[3,1](close))
indicator2W = MACDline[8,26,9](close)
c1W = (indicator1W CROSSES UNDER 22) AND (indicator2W > 0)
c2W = (indicator1W CROSSES OVER  78) AND (indicator2W < 0)
IF c1W THEN
   xW   = 1000
ELSIF c2W THEN
   xW   = 2000
ELSE
   xW   = 9000
ENDIF
//
TIMEFRAME(Daily)
indicator1D = Average[1](Stochastic[3,1](close))
indicator2D = MACDline[8,26,9](close)
c1D = (indicator1D CROSSES UNDER 22) AND (indicator2D > 0)
c2D = (indicator1D CROSSES OVER  78) AND (indicator2D < 0)
IF c1D THEN
   xD   = 100
ELSIF c2D THEN
   xD   = 200
ELSE
   xD   = 900
ENDIF
//
TIMEFRAME(4 hours)
indicator14 = Average[1](Stochastic[3,1](close))
indicator24 = MACDline[8,26,9](close)
c14 = (indicator14 CROSSES UNDER 22) AND (indicator24 > 0)
c24 = (indicator14 CROSSES OVER  78) AND (indicator24 < 0)
IF c14 THEN
   x4   = 10
ELSIF c24 THEN
   x4   = 20
ELSE
   x4   = 90
ENDIF
//
TIMEFRAME(1 hour)
indicator11 = Average[1](Stochastic[3,1](close))
indicator21 = MACDline[8,26,9](close)
c11 = (indicator11 CROSSES UNDER 22) AND (indicator21 > 0)
c21 = (indicator11 CROSSES OVER  78) AND (indicator21 < 0)
IF c11 THEN
   x1   = 1
ELSIF c21 THEN
   x1   = 2
ELSE
   x1   = 9
ENDIF
//
TIMEFRAME(DEFAULT)
Result = xW + xD + x4 + x1
IF Result = 9999 THEN
   Result = 0
ENDIF
SCREENER[Result] (Result AS "wd41")
Hi, thank you for your help.
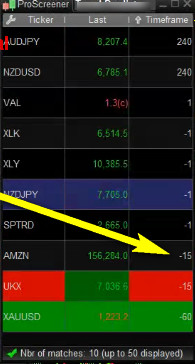
The screener worked, but I have no idea what timeframes they are when I run the screener
. Is there a way to display and identify each of the timeframes as per attached or any other solution you can think of?
This is the multi timeframe Proscreener and it has Timeframe field to display the individual timframes and recognize them
Also, – numbers shows it a sell alert
You must have read my first reply partially, since at the beginning of the code (comments) and in the attached pics there was an explanation of how the output would look like.