N days historical Pivot points – Help needed.

Viewing 10 posts - 1 through 10 (of 10 total)
  • Author
    Posts
  • #141500 quote
    boonet
    Participant
    Senior

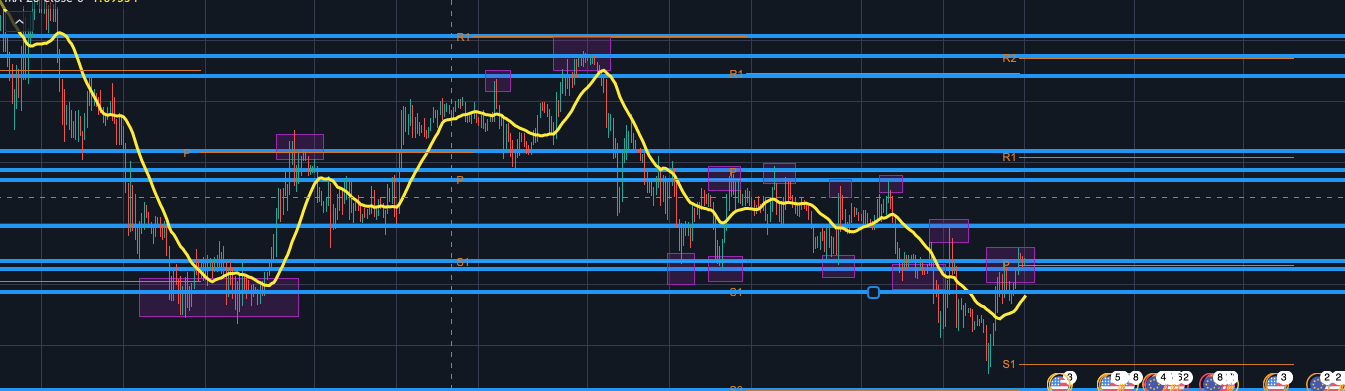
    I found that the price usually fluctuates between pivot points from last three days.

    Please see attached example screenshot.

    In the attached example –

    • All the blue lines are the pivot points of last 3 days which I drew manually
    • Highlighted in purple are the points where price bounced off.

    It would be very handy to have an indicator which shows pivot points from last 3 days.(or n days)

    Can someone please help coding it?


    Thanks in advance.

    ppoints.png ppoints.png
    #141503 quote
    Nicolas
    Keymaster
    Legend

    There is a default indicator named “pivot points” in the platform, it plots pivot points from the last X days. You can either use the calculation mode and the time horizons of the pivots (hourly, weekly, monthly, daily, …).

    #141505 quote
    boonet
    Participant
    Senior

    Hi @Nicolas,
    yes, I have used the default pivot points indicator, but problem is that it doesn’t extend the lines to current day.

    So basically I want a the pivot lines of last three days on to currrent day chart automatically.

    #141508 quote
    Nicolas
    Keymaster
    Legend

    Oh i see now! the below code should plots the last 3 days pivot points:

    p1 = (dhigh(1)+dlow(1)+dclose(1))/3
    p2 = (dhigh(2)+dlow(2)+dclose(2))/3
    p3 = (dhigh(3)+dlow(3)+dclose(3))/3
    
    return p1,p2,p3
    #141520 quote
    boonet
    Participant
    Senior

    Thanks a lot @Nicolas.

    Tried this code.

    p1 = (dhigh(1)+dlow(1)+dclose(1))/3
    p2 = (dhigh(2)+dlow(2)+dclose(2))/3
    p3 = (dhigh(3)+dlow(3)+dclose(3))/3
     
    DRAWLINE(barindex-1,p1,barindex,p1) coloured(153,153,0)
    DRAWLINE(barindex-1,p2,barindex,p2) coloured(153,153,0)
    DRAWLINE(barindex-1,p3,barindex,p3) coloured(153,153,0)
    
    return
    

    This generates several lines on the chart may be because there is no conditional statement to restrict it to 3 days.

    See attached screenshot.
    Sorry may be my newbie knowledge.

    2020-08-13_1415.png 2020-08-13_1415.png
    #141525 quote
    Nicolas
    Keymaster
    Legend

    Add this line to draw only the last candlestick, otherwise it will draw lines of pivot points all over the past history too.

    defparam drawonlastbaronly=true
    #141532 quote
    boonet
    Participant
    Senior

    Thanks a lot @Nicolas.

    It worked. Here is the full code

    defparam drawonlastbaronly=true
    
    p1 = (dhigh(1)+dlow(1)+dclose(1))/3
    p2 = (dhigh(2)+dlow(2)+dclose(2))/3
    p3 = (dhigh(3)+dlow(3)+dclose(3))/3
    
    r11 = 2*p1 - dlow(1)
    r12 = 2*p2 - dlow(2)
    r13 = 2*p3 - dlow(3)
    
    s11 = 2*p1 - dhigh(1)
    s12 = 2*p2 - dhigh(2)
    s13 = 2*p3 - dhigh(3)
    
    r21 = p1 + (dhigh(1)-dlow(1))
    r22 = p2 + (dhigh(2)-dlow(2))
    r23 = p3 + (dhigh(3)-dlow(3))
    
    s21 = p1 - (dhigh(1)-dlow(1))
    s22 = p2 - (dhigh(2)-dlow(2))
    s23 = p3 - (dhigh(3)-dlow(3))
    
    r31 = r11+(dhigh(1)-dlow(1))
    r32 = r12+(dhigh(2)-dlow(2))
    r33 = r13+(dhigh(3)-dlow(3))
    
    
    s31 = s11-(dhigh(1)-dlow(1))
    s32 = s12-(dhigh(2)-dlow(2))
    s33 = s13-(dhigh(3)-dlow(3))
     
    DRAWLINE(barindex-1,p1,barindex,p1) coloured(153,153,0)
    DRAWLINE(barindex-1,p2,barindex,p2) coloured(153,153,0)
    DRAWLINE(barindex-1,p3,barindex,p3) coloured(153,153,0)
    
    
    DRAWLINE(barindex-1,r11,barindex,r11) coloured(170,153,0)
    DRAWLINE(barindex-1,r12,barindex,r12) coloured(170,153,0)
    DRAWLINE(barindex-1,r13,barindex,r13) coloured(170,153,0)
    
    DRAWLINE(barindex-1,s11,barindex,s11) coloured(170,153,0)
    DRAWLINE(barindex-1,s12,barindex,s12) coloured(170,153,0)
    DRAWLINE(barindex-1,s13,barindex,s13) coloured(170,153,0)
    
    DRAWLINE(barindex-1,r21,barindex,r21) coloured(170,153,0)
    DRAWLINE(barindex-1,r22,barindex,r22) coloured(170,153,0)
    DRAWLINE(barindex-1,r23,barindex,r23) coloured(170,153,0)
    
    DRAWLINE(barindex-1,s21,barindex,s21) coloured(170,153,0)
    DRAWLINE(barindex-1,s22,barindex,s22) coloured(170,153,0)
    DRAWLINE(barindex-1,s23,barindex,s23) coloured(170,153,0)
    
    DRAWLINE(barindex-1,r31,barindex,r31) coloured(170,153,0)
    DRAWLINE(barindex-1,r32,barindex,r32) coloured(170,153,0)
    DRAWLINE(barindex-1,r33,barindex,r33) coloured(170,153,0)
    
    DRAWLINE(barindex-1,s31,barindex,s31) coloured(170,153,0)
    DRAWLINE(barindex-1,s32,barindex,s32) coloured(170,153,0)
    DRAWLINE(barindex-1,s33,barindex,s33) coloured(170,153,0)
    
    return
    
    #141534 quote
    boonet
    Participant
    Senior

    Hi @Nicolas,

    From the above code I want to frame something like –


    data = min(abs(close-r11),min(abs(close-r12),min(abs(close-r13),min(abs(close-s11),min(abs(close-s12),abs(close-s13))))))


    c1 = (data/close*100)<=Percent/100
    
    screener [c1](data/close*100)

    How can I integrate all 21 variables(S11,S12,S13…..P1,P2,P3, …..R31,R32,R33) in above equation data=____ ?

    #141576 quote
    Nicolas
    Keymaster
    Legend

    code many “data” and “c1” variables with different names for any of your pivot points and change the screener line with: screener[c1 OR c2 OR c3 OR ………….]

    boonet thanked this post
    #141610 quote
    boonet
    Participant
    Senior

    You are a star !

Viewing 10 posts - 1 through 10 (of 10 total)

  • You must be logged in to reply to this topic.

ProRealAI ProRealAI New

Stuck on this ProBuilder code?

Describe what this topic is trying to build, in plain English, and ProRealAI writes the ProRealTime™ indicator, screener or system for you.

Available in 7 languages
Try ProRealAI

N days historical Pivot points – Help needed.


ProBuilder: Indicators & Custom Tools

New Reply
Author
author-avatar
boonet @boonet Participant
Summary

This topic contains 9 replies,
has 2 voices, and was last updated by boonet

6 years, 1 month ago.

Topic Details
Forum: ProBuilder: Indicators & Custom Tools
Language: English
Started: 08/13/2020
Status: Active
Attachments: 2 files
Logo Logo
Loading...