Power Play Screener (Minervini)
Forums › ProRealTime English forum › ProScreener support › Power Play Screener (Minervini)
- This topic has 9 replies, 2 voices, and was last updated 3 years ago by
 JS.
JS.
-
-
04/23/2022 at 9:05 PM #192132
Mark Minervini is one of the greatest traders on earth. We all know about his VCP setup, but in his books he also describes the Power Play setup. While I was extremely pleased in finding a screener inspired by the former here: https://www.prorealcode.com/prorealtime-market-screeners/trend-template-mark-minervini/ I found no trace of a screener that can filter potential Power Play setups. It would be great to make this available to Prorealtime users:
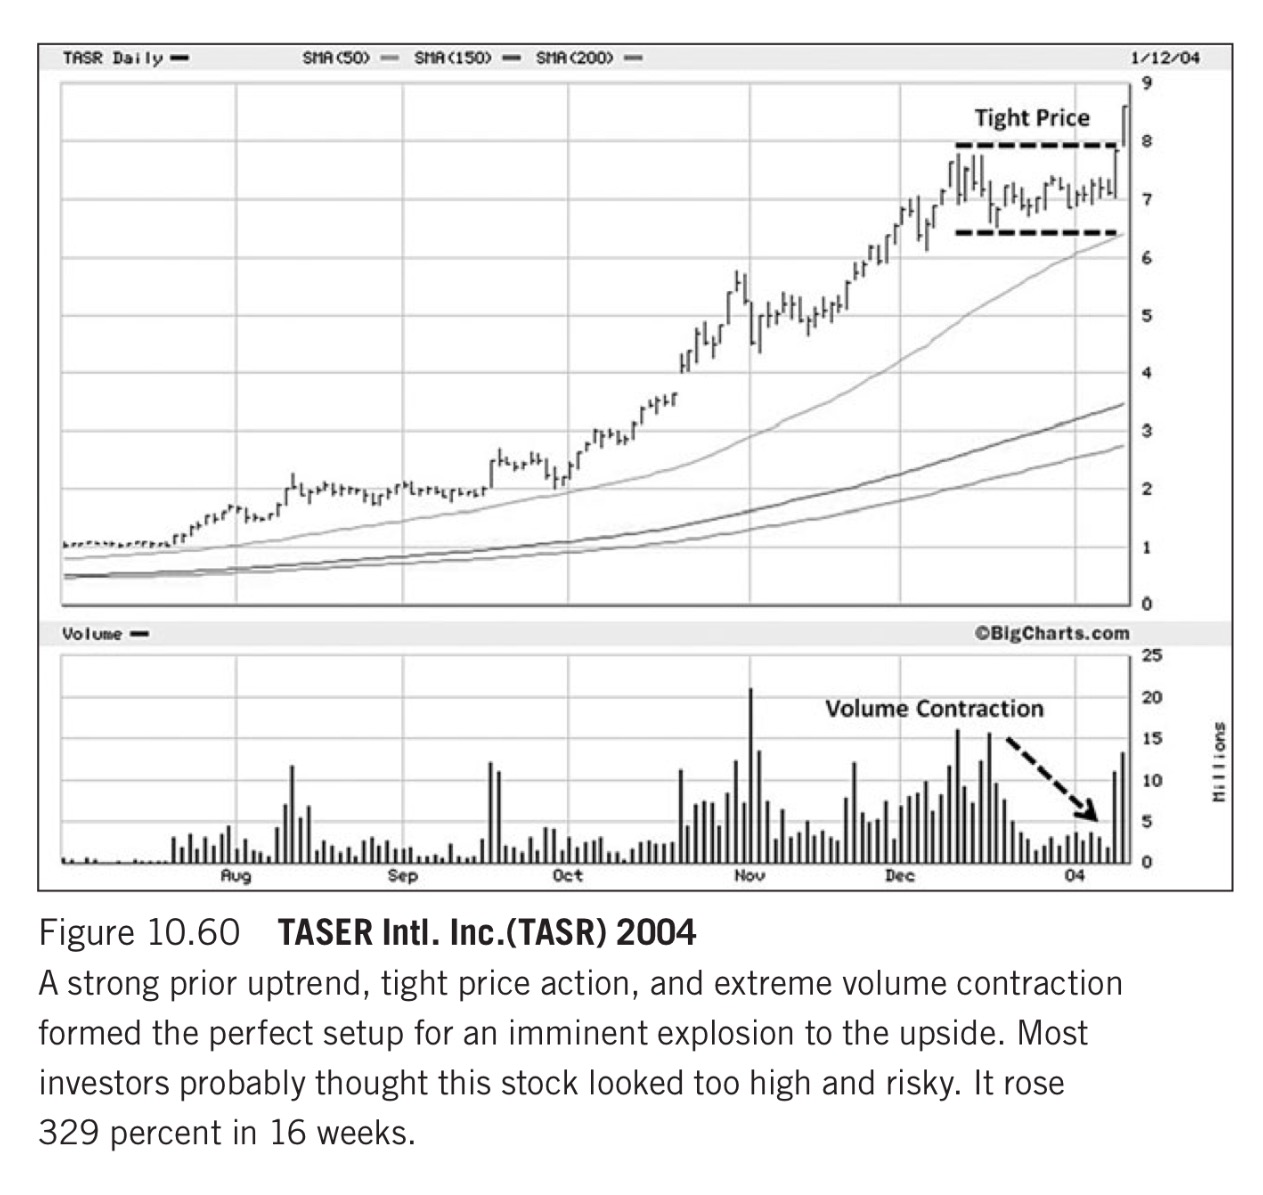
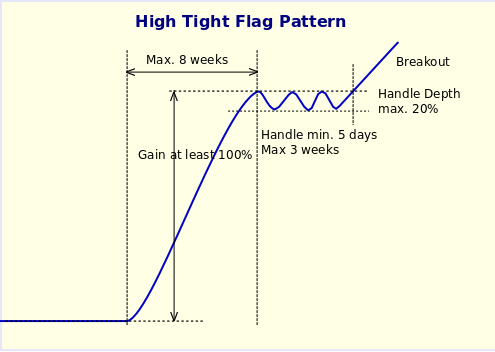
According to Mr. Minervini, to qualify as a power play, the following criteria must be met:
- An explosive price move on huge volume that propels the stock price up 100 percent or more within eight weeks. Stocks that have already made a huge gain coming off a late-stage base usually don’t qualify.
- Following the explosive move, the stock price moves sideways in a relatively tight range, not correcting more than 20 percent (some lower-priced stocks can correct as much as 25 percent) over a period of three to six weeks (some can emerge after only 10 or 12 days).
- If the correction in the base, from high to low, does not exceed 10 percent, it is not necessary to see price tightening in the form of a volatility contraction, because the price is already tight enough.
Do you think this is feasible? Thank you very much for your help!
04/23/2022 at 10:03 PM #19213304/24/2022 at 4:59 PM #19215604/26/2022 at 9:32 PM #192257Power Play1234567891011PoleHigh = Highest[9*5](High)PoleLow = Lowest[9*5](Low)a = PoleHigh > 2 * PoleLowb = BarsSince(a) > 5 and BarsSince(a) < 15FlagLow = Lowest[15](Low)c = FlagLow / PoleHigh > 0.75d = Close > PoleHighIf a and b and c and d thenDrawArrowUp(BarIndex,Close)EndIfReturnSorry @Frank, I think this should be solved using arrays due to the varying time intervals.
I did try something, without arrays, but that was a failure… (maybe you can make something out of it)
1 user thanked author for this post.
04/26/2022 at 10:29 PM #192258Hi JS,
Thank you for taking the time to help me. I’m not a coder. I’ve also found this code here: https://www.prorealcode.com/topic/cup-and-handle-pattern-andhigh-tight-flag-and-vcp-volatility-pattern/ and I’ve just changed the number of days of the variable “now”. Which one do you think would fit my requirements better? I’d like to stick to Minervini’s template as much as I can.
1234567891011121314151617timeframe(weekly)//gain at least 100% in the last 8 weeksif (close-close[8])/close[8]>=1 thenhh=highendiftimeframe(default)if hh<>hh[1] and hh>hh[1] thenstart=barindexendifnow = barindex-startc1 = high<hhc2 = (hh-close)/hh<0.2c3 = now>=15 and now<=30conditions = c1 and c2 and c3screener [conditions] (now)04/26/2022 at 10:49 PM #19225904/26/2022 at 10:54 PM #192260Hi @JS.
I’ve just copied the code and changed the days because I intuitively understood that the original one was considering a timeframe between 5 days and 3 weeks, whereas I need to consider a timeframe between 3 and 6 weeks according to Minervini. As I mentioned earlier, the original code is here: https://www.prorealcode.com/topic/cup-and-handle-pattern-andhigh-tight-flag-and-vcp-volatility-pattern/ and it was written by @nicolas. Perhaps he might be willing to tell us his opinion as well.
04/26/2022 at 11:06 PM #192262Hi @Frank
What do you mean by “a timeframe between 5 days and 3 weeks”?
The original code uses a weekly timeframe and a daily timeframe.
TF weekly => close[8] is 8 weeks back…
TF daily => 5 (min.5 days) and 15 (max. 15 days = 3 weeks)
04/26/2022 at 11:35 PM #192263Hi @JS,
I refer to Minervini’s template (first post above):
- Following the explosive move, the stock price moves sideways in a relatively tight range, not correcting more than 20 percent (some lower-priced stocks can correct as much as 25 percent) over a period of three to six weeks (some can emerge after only 10 or 12 days).
04/27/2022 at 8:22 AM #192273 -
AuthorPosts
Find exclusive trading pro-tools on 


