Dear All,
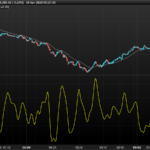
I just noticed two new indicators from Ehlers on the last issue of Stock & Commodities: Reflex and Trendlex Indicators.
I would be greatfull if you code them from easylanguage to prt. I attach the 2 codes.
Best regards
ML
{ Reflex Indicator (C) 2019 John F. Ehlers }
Inputs: Length(20 );
Vars: Slope(0 ), sum(0 ), count(0 ), a1(0 ), b1(0 ), c1(0 ), c2(0 ), c3(0 ), Filt(0 ), MS(0 ), Reflex(0 );
//Gently smooth the data in a SuperSmoother a1 = expvalue(-1.414*3.14159 / (.5*Length)); b1 = 2*a1*Cosine(1.414*180 / (.5*Length)); c2 = b1; c3 = -a1*a1; c1 = 1 - c2 - c3; Filt = c1*(Close + Close[1]) / 2 + c2*Filt[1] + c3*Filt[2];
//Length is assumed cycle period Slope = (Filt[Length] - Filt) / Length;
//Sum the differences Sum = 0; For count = 1 to Length Begin Sum = Sum + (Filt + count*Slope) - Filt[count]; End;
Sum = Sum / Length;
//Normalize in terms of Standard Deviations MS = .04*Sum*Sum + .96*MS[1]; If MS <> 0 Then Reflex = Sum / SquareRoot(MS);
Plot1(Reflex); Plot2(0 );
{ Trendflex Indicator (C) 2019 John F. Ehlers }
Inputs: Length(20 );
Vars: sum(0 ), count(0 ), a1(0 ), b1(0 ), c1(0 ), c2(0 ), c3(0 ), Filt(0 ), MS(0 ), Trendflex(0 );
//Gently smooth the data in a SuperSmoother a1 = expvalue(-1.414*3.14159 / (.5*Length)); b1 = 2*a1*Cosine(1.414*180 / (.5*Length)); c2 = b1; c3 = -a1*a1; c1 = 1 - c2 - c3; Filt = c1*(Close + Close[1]) / 2 + c2*Filt[1] + c3*Filt[2];
//Sum the differences Sum = 0; For count = 1 to Length Begin Sum = Sum + Filt - Filt[count]; End;
Sum = Sum / Length;
//Normalize in terms of Standard Deviations MS = .04*Sum*Sum + .96*MS[1]; If MS <> 0 Then Trendflex = Sum / SquareRoot(MS);
Plot1(Trendflex); Plot2(0 );