ONCE Capital = 10000
Please look at the code again, i have added the capital before running it.
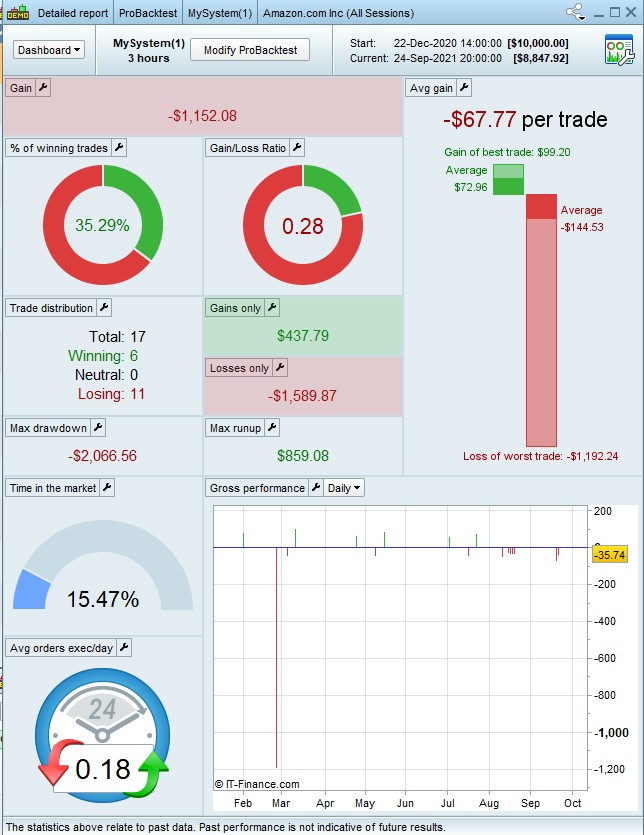
You tested it on AMAZON (alla sessions), 3h TF, 1K units, didn’t you? : Yes you are correct
I added CAPITAL, not you!
I can’t see any code of yours with CAPITAL in it. I need your working code.
so am a bit confused when you asked “Have you got / enabled your Demo Account?”
I didn’t have time to check back over your screen shots … you mentioned Live running and I was making sure you not lose real money.
How do i find same chart types
You show the Detailed Report and I was showing the Equity Curve which is very useful to assess a strategy.
@Rotertogozzi.,
I have done exactly as you have instructed, please see attached backtest results Before and After adding the Risk management.
Am not able to analyse the results in terms of whether there is improvement or not.
I need your help.
regards.
Hello,
Looks like the initial technical issue is solved as there is no more error.
Regarding the results, it’s another story. 16 trades is too small to conclude anything. The first screenshots shared show à lower drawdown max, which is the main purpose of risk management techniques. However, it can impact lower gains and lower % winning trade, as less risk is taken. Logical, though you may not be satisfied by the results.
@Roberogozzi,
Thanks, i just copied and paste exactly your modified version:
Also see attached screenshot of the result.
//——-Risk_Money_Management———-
// DrawDown calculation
ONCE Capital = 10000
ONCE MinPoint = Capital
ONCE MaxPoint = 0
ONCE MaxRU = 0
ONCE MaxDD = 0
ONCE LotSize = 1
IF StrategyProfit <> 0 THEN
Equity = Capital + StrategyProfit
TempProfit = PositionPerf * PositionPrice / PipSize
TempEquity = Equity + TempProfit
MaxPoint = max(MaxPoint,TempEquity)
DD = MaxPoint – TempEquity
MaxDD = max(MaxDD,DD)
//——————————————
// LARRY WILLIAMS’ formula (+margin)
MinSize = 1 //Minimum lot size allowed
Margin = high / 100 * 0.5 //Margin required 0.5%
Risk = 5 //Risk per trade 2%
TempLotSize = max(MinSize,(Equity * Risk / 100) / (MaxDD + Margin))
LotSize = round((TempLotSize * 10) – 0.5) / 10 //only 1 decimal digit allowed
LotSize = max(MinSize,LotSize)
ENDIF
//LotSize = 1
//——————————————
//—-Backtest——-
p = 20
MyLongConditions = close CROSSES OVER BollingerDOWN[p]
MyShortConditions = close CROSSES UNDER BollingerUP[p]
//MinWidth = 0.01 //max percentage of distance between the two bands
MyBandWidth = BollingerBandWidth[p](close)
upper = bollingerup[p]
lower = bollingerdown[p]
middle = average[p]
BandwidthAbs= upper-lower
BandwidthCentage= (BandwidthAbs/middle)*100
//Bandwidth% should be adjusted based on securities and timeframes
// ATR Profit Target & Stop Loss
Atr = AverageTrueRange[14](Close)
IF MyLongConditions AND Not OnMarket AND BandwidthCentage > 2.00 THEN
BUY LotSize CONTRACTS AT MARKET
SET STOP LOSS Atr
SET TARGET PROFIT Atr * 1.8
//SET TARGET PROFIT Atr * 1.8
ENDIF
IF MyShortConditions AND LongOnMarket AND BandwidthCentage > 2.00 THEN
SELL AT MARKET
ENDIF
@Swingueur,
Thanks for giving me more education that 16 trades are too small to be able to make meaningful conclusions, is it possible you provide a guideline about the minimum number of trades considered to be reasonable.
You stated this “The first screenshots shared show à lower drawdown max, which is the main purpose of risk management techniques”, but i dont know which of the screenshots you are referring to. Remember all my screenshots i have shared are all showing extremely far far higher drawdown max after adding risk management, and which is one of my major concerns throughout these threads.
Please can you show me navigations to access the Equity Curve, i tried but couldnt find it.
@Swingueur,
Thanks for giving me more education that 16 trades are too small to be able to make meaningful conclusions, is it possible you provide a guideline about the minimum number of trades considered to be reasonable.
You stated this “The first screenshots shared show à lower drawdown max, which is the main purpose of risk management techniques”, but i dont know which of the screenshots you are referring to. Remember all my screenshots i have shared are all showing extremely far far higher drawdown max after adding risk management, and which is one of my major concerns throughout these threads.
At least 100, as we can see on internet. 1000+ to be more comfortable I believe, but I’m not an expert either. You can put max data history available to qualify the results you will get.
I was referring of the screenshots in this post
Before risk management -$543; After risk management -$288 => The code reduces the max drowdawn.
However, there is no more profit and more losing trades, on a 16 sample.
How it behaves with more trades?
What is the spread/fees?
Is the strategy that good before risk management? (what about other assets?)
etc..
I could spot some glitches in the code of the Risk Management section.
This is the working code:
//——-Risk_Money_Management———-
// DrawDown calculation
ONCE Capital  = 10000
ONCE MinPoint = Capital
ONCE MaxDD    = 0
ONCE LotSize  = 1
ONCE Trades   = 0
IF OnMarket AND Not OnMarket[1] THEN
   Trades =  Trades +1
ENDIF
IF StrategyProfit <> 0 AND Trades > 1 THEN
   Equity     = Capital + StrategyProfit
   TempProfit = PositionPerf * PositionPrice / PipSize
   TempEquity = Equity + TempProfit
   MinPoint   = min(MinPoint,TempEquity)
   DD         = MinPoint - TempEquity
   MaxDD      = min(MaxDD,DD)
   //——————————————
   // LARRY WILLIAMS’ formula (+margin)
   MinSize     = 1 //Minimum lot size allowed
   Margin      = high / 100 * 0.5 //Margin required 0.5%
   Risk        = 5 //Risk per trade 2%
   TempLotSize = max(MinSize,(Equity * Risk / 100) / (MaxDD + Margin))
   LotSize     = round((TempLotSize * 10) - 0.5) / 10 //only 1 decimal digit allowed
   LotSize     = max(MinSize,LotSize)
ENDIF
//LotSize = 1
//——————————————
//—-Backtest——-
p = 20
MyLongConditions  = close CROSSES OVER BollingerDOWN[p]
MyShortConditions = close CROSSES UNDER BollingerUP[p]
//MinWidth = 0.01 //max percentage of distance between the two bands
MyBandWidth = BollingerBandWidth[p](close)
upper = bollingerup[p]
lower = bollingerdown[p]
middle = average[p]
BandwidthAbs= upper-lower
BandwidthCentage= (BandwidthAbs/middle)*100
//Bandwidth% should be adjusted based on securities and timeframes
// ATR Profit Target & Stop Loss
Atr = AverageTrueRange[14](Close)
IF MyLongConditions AND Not OnMarket AND BandwidthCentage > 2.00 THEN
BUY LotSize CONTRACTS AT MARKET
SET STOP LOSS Atr
SET TARGET PROFIT Atr * 1.8
//SET TARGET PROFIT Atr * 1.8
ENDIF
IF MyShortConditions AND LongOnMarket AND BandwidthCentage > 2.00 THEN
SELL AT MARKET
ENDIF
Because there was an error using MAX instead of MIN to calculate the DrawDown and it must operate AFTER the first trade, because at the beginning DrawDown is zero, so the number of lots was overcalculated.
Hello,
Am modifying my strategy by adding RSI indicator:
rsi_14 = RSI[14](close)
Return rsi_14
This indicator is plotted on the chart but unfortunately the overbought line, 70 and oversold line 30, are not showing or drawn on the indicator.
How do i fix this?