


rsi linear regresion

Viewing 3 posts - 1 through 3 (of 3 total)

  • Author
    Posts
  • #128005 quote
    quini999quini999
    Participant
    Veteran

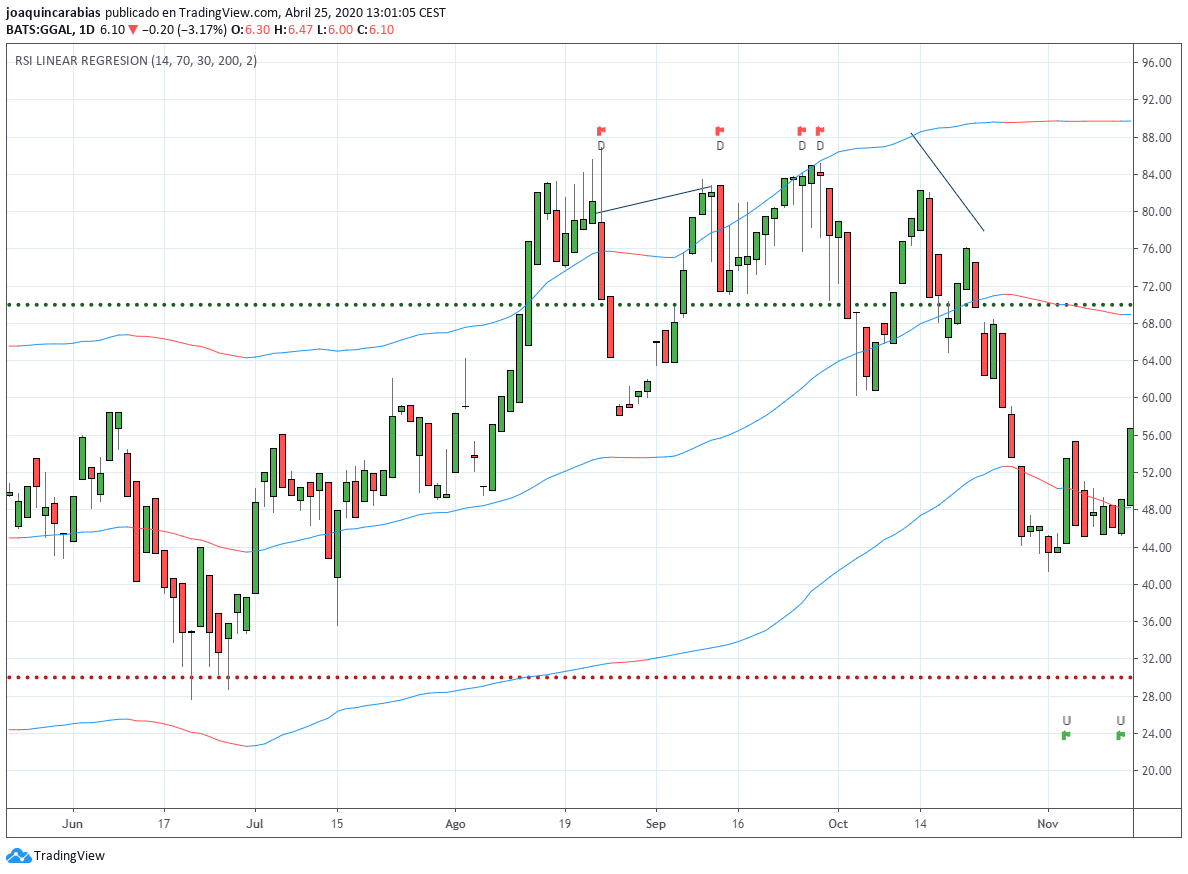
    Quiero que conviertan éste indicador de tradingview para prorealtime

    //@version=4
    study("RSI LINEAR REGRESION")
    len = input(21, "RSI Length", minval=1)
    rsi = rsi(close, len)
    
    t(x) => security( syminfo.tickerid, timeframe.period, rsi(x, len))
    
    o = t(open)
    h = t(high)
    l = t(low)
    c = t(close)
    upper=input(70)
    lower=input(30)
    plot(upper, color=color.orange)
    plot(lower, color=color.green)
    plotcandle(o, h, l, c, color=o < c ? color.green : color.red)
    
    plot(rsi,color=color.black,linewidth=2)
    //
    period     = input(     200, "Period"       , input.integer, minval=3)
    deviations = input(    2.0, "Deviation(s)" , input.float  , minval=0.1, step=0.1)
    periodMinusOne = period-1
    Ex = 0.0, Ey = 0.0, Ex2 = 0.0, Exy = 0.0, for i=0 to periodMinusOne
        closeI = nz(rsi[i]), Ex := Ex + i, Ey := Ey + closeI, Ex2 := Ex2 + (i * i), Exy := Exy + (closeI * i)
    ExEx = Ex * Ex, slope = Ex2==ExEx ? 0.0 : (period * Exy - Ex * Ey) / (period * Ex2 - ExEx)
    linearRegression = (Ey - slope * Ex) / period
    intercept = linearRegression + bar_index * slope
    deviation = 0.0, for i=0 to periodMinusOne
        deviation := deviation + pow(nz(rsi[i]) - (intercept - slope * (bar_index[i])), 2.0)
    deviation := deviations * sqrt(deviation / periodMinusOne)
    startingPointY = linearRegression + slope / periodMinusOne
    lineColor = startingPointY > startingPointY[1] ? color.blue : color.red
    a=plot(startingPointY-deviation, title=" Curve low", color=lineColor, linewidth=3, transp=0)
    c1 = plot(startingPointY, title=" Curve", color=lineColor, linewidth=3, transp=0)
    b=plot(startingPointY+deviation, title=" Curve high", color=lineColor, linewidth=3, transp=0)
    z=startingPointY-deviation
    up=crossover(rsi,z)
    p=startingPointY+deviation
    down=crossunder(rsi,p)
    plotshape(up, title='UP', style=shape.xcross, color=color.green, location=location.bottom, textcolor=color.black, text="U", transp = 0, size = size.tiny)
    plotshape(down , title='down', style=shape.cross, color=color.red, location=location.top, textcolor=color.black, text="D", transp = 0, size = size.tiny)
    RSI-QUINI.png RSI-QUINI.png
    #145220 quote
    NicolasNicolas
    Keymaster
    Legend

    El código que ha compartido no estaba completo, lo encontré en la web y lo reemplacé. La próxima vez, intente agregar una descripción sobre qué es el indicador y cómo debe usarse para operar. Agregué esta conversión a mi lista y lo hago lo antes posible (sé que llegué tarde en este tema, lo siento, fue debido a consultas masivas en el momento en que publicó debido al bloqueo y la pandemia).

    #145361 quote
    NicolasNicolas
    Keymaster
    Legend

    El indicador se ha traducido con éxito para ProRealTime, puede descargarlo directamente de la biblioteca en esta página: RSI y señales comerciales de regresión lineal

Viewing 3 posts - 1 through 3 (of 3 total)
  • You must be logged in to reply to this topic.

ProRealAI ProRealAI New

Stuck on this ProBuilder code?

Describe what this topic is trying to build, in plain English, and ProRealAI writes the ProRealTime™ indicator, screener or system for you.

Available in 7 languages
Try ProRealAI

rsi linear regresion


ProBuilder: Indicadores y Herramientas

New Reply
Author
author-avatar
quini999 @quini999 Participant
Summary

This topic contains 2 replies,
has 2 voices, and was last updated by NicolasNicolas

6 years ago.

Topic Details
Forum: ProBuilder: Indicadores y Herramientas
Language: Spanish
Started: 04/25/2020
Status: Active
Attachments: 1 files
ProRealCode ProRealCode
Loading...

