In reply to this question https://www.prorealcode.com/topic/risk-and-money-management-errors/page/2/#post-178768, this is my reply.
Make the last line read:
Return rsi_14 AS "Rsi",70 AS "OverBought",30 AS "OverSold"
@robertogozzi
Many thanks for the solution.
Now lets say a typical instrument presenting both ranging and trending market conditions over some periods. I want to add RSI crossover indicator signals and RSI divergence indicator signals to Bollinger bands such that whatever market conditions currently being presented the appropriate or corresponding signal will trigger.
May i know how feasible this strategy can be?
Regards.
Start new topics for different questions.
Thanks 🙂
I did it.
I’ll make it asap.
@ Robertogozzi
Please i don’t understand your previous message, does it mean you have already created a different topic for this? If so where is it, how can i access it?
May i know whether you also mean you will be able to help me in writing this strategy?
Hello can you reply so i can proceed for there please.
Do not double post. Ask your question only once and only in one forum. All double posts will be deleted anyway so posting the same question multiple times will just be wasting your own time and will not get you an answer any quicker. Double posting just creates confusion in the forums.
Thank you 🙂
I ALREADY replied you and did it (it wasn’t the same topic as before, couldn’t you see that?), as I already told you.
Be patient, I will do it as soon as possible (that’s what asap means).
There you go. This indicator will return:
- 1 = bullish signal
- -1 = bearish signal
You will set settings as best suits you.
I suggest that you set the properties so that the signal is plotted as a histogram.
// BB-Rsi-Rsi Divergences
//
// settings
//ONCE RsiP  = 14                           //14  RSI periods
//ONCE RsiOB = 70                           //70 - 30 (Overbought & Oversold)
//ONCE DivLB = 40                           //40  lookback periods for divergences
//ONCE BB    = 20                           //20  Bollinger Bands periods
ONCE RsiP    = max(1,min(999,RsiP))
ONCE RsiOB   = max(0,min(100,RsiOB))
ONCE DivLB   = max(1,min(999,DivLB))
ONCE RsiOS   = 100 - RsiOB
// RSI divergences
MyDivergence = DivergenceRSI[RsiP,RsiOS,RsiOB,DivLB](close)
L1           = (MyDivergence = 1)           //bullish divergence
S1           = (MyDivergence = -1)          //bearish divergence
// RSI crossovers
MyRSI        = Rsi[14](close)
L2           = MyRsi CROSSES OVER  RsiOS    //bullish crossover
S2           = MyRsi CROSSES UNDER RsiOB    //bearish crossover
// BB (Bollinger Bands crossovers)
L3           = close CROSSES OVER  BollingerDOWN[BB]
S3           = close CROSSES UNDER BollingerUP[BB]
// combine Long & Short conditions
Lcond       = L1 AND L2 AND L3
Scond       = S1 AND S2 AND S3
// return the correct triggering signal
Signal      = 0
IF Lcond THEN
   Signal = 1        //LONG  Signal
ELSIF Scond THEN
   Signal = -1       //SHORT Signal
ENDIF
RETURN Signal AS "(Signal: 1=↑, -1=↓)    ",0 AS "Zero"
I also suggest that you import the attached ITF file where variables are already defined and declared. If you prefer to Copy & Paste the above code, uncomment lines 4-7.
@robertogozzi
Am so grateful for the codes.
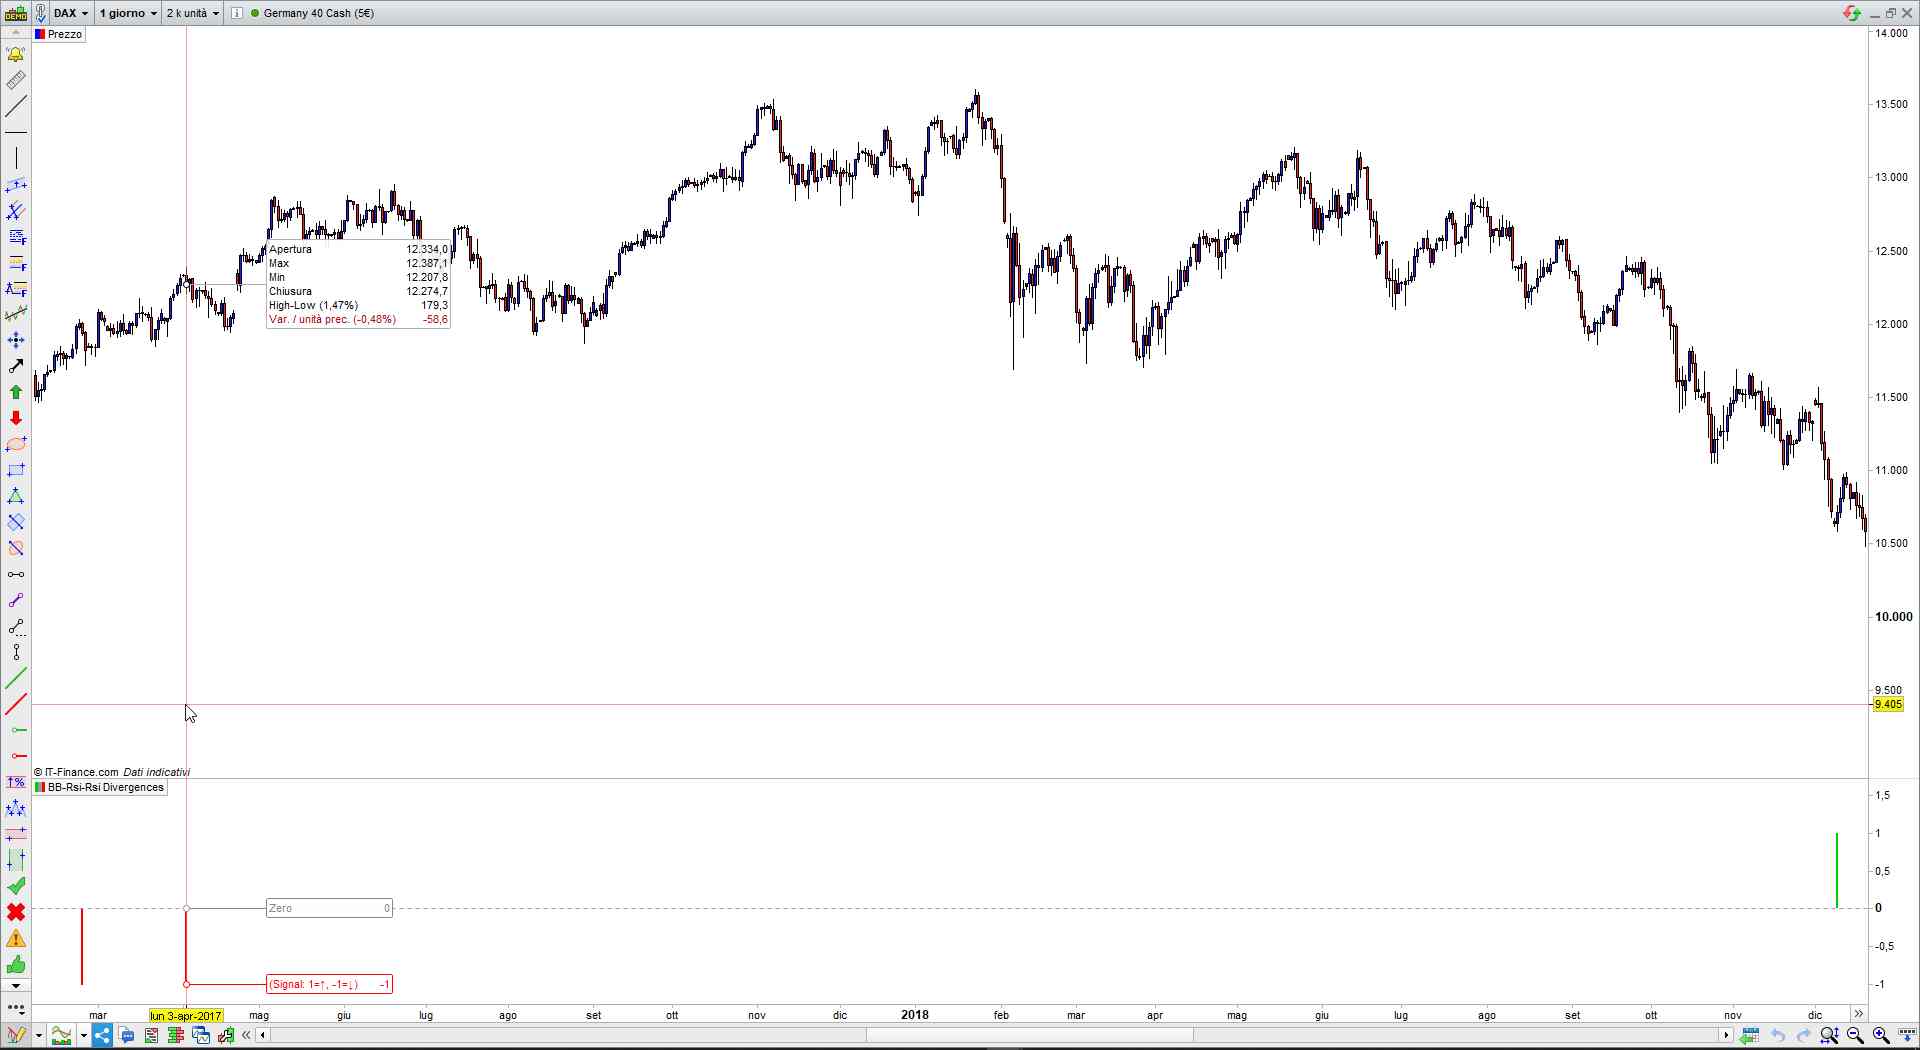
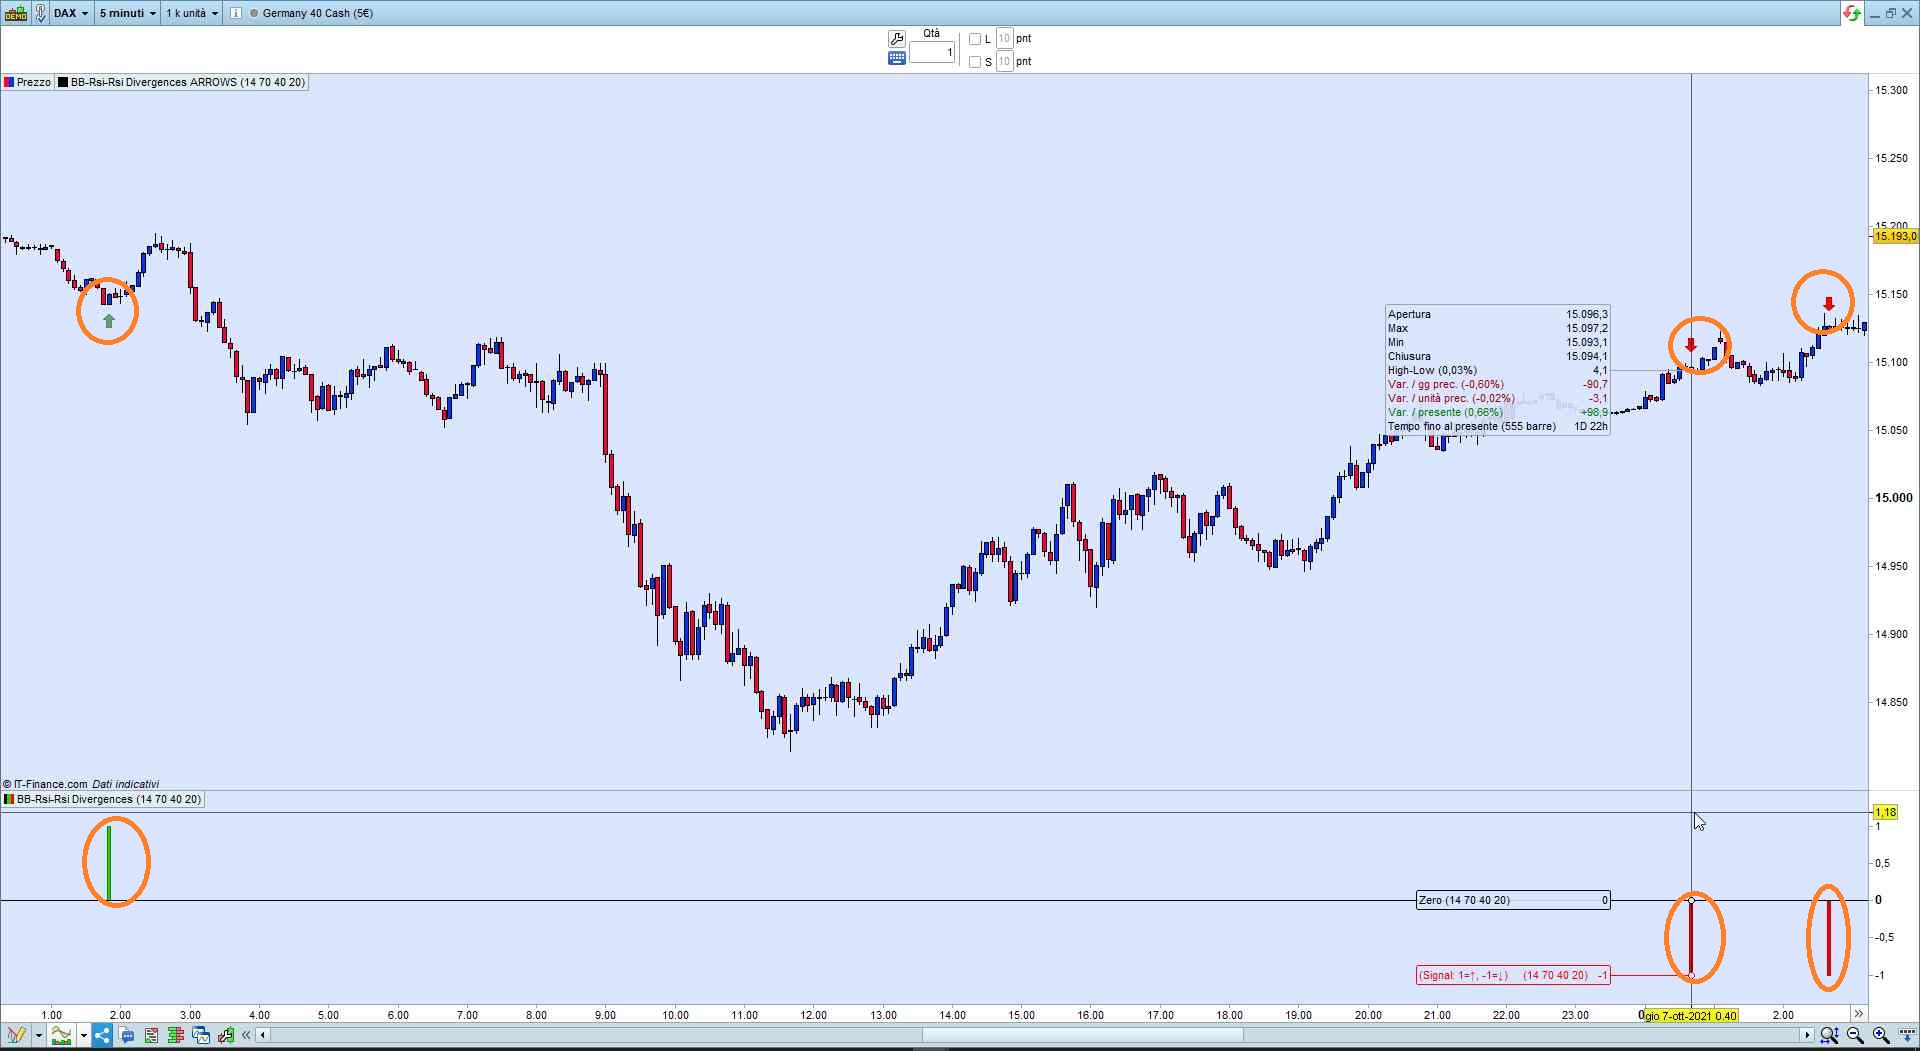
After running according to your instruction i got the result in the attached screenshot.
Please can you help me interpret the result? am not familiar with the histogram presentation.
Also the signal symbols (arrows ) are not printed on the chart.
Also how are we able to confirm the RSI Crossover signals are confined to ranging conditions only?
Regards.
Sorry i forgot to attached the screenshot
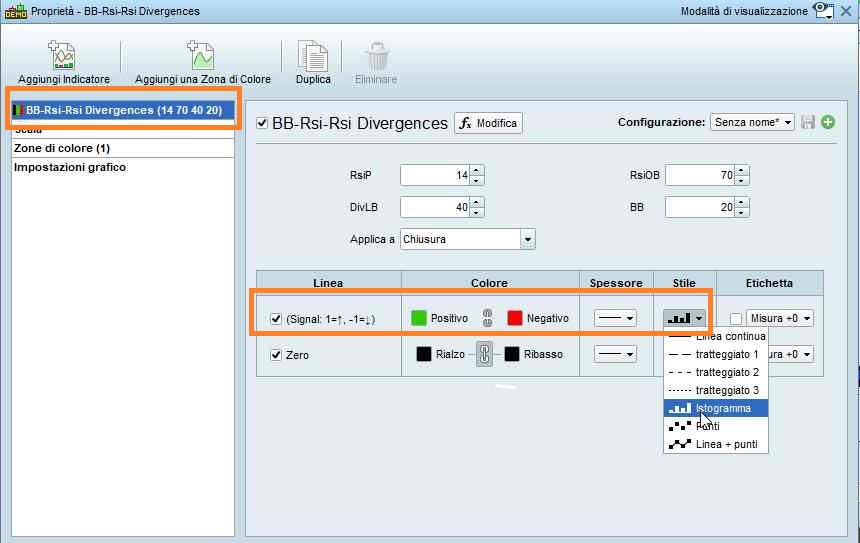
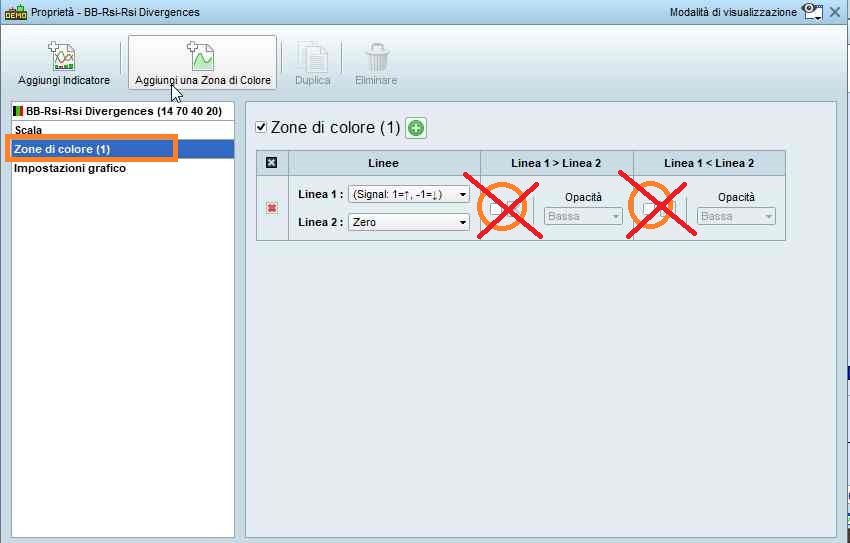
Open the indicator’s setting (xPic) and select HISTOGRAM (you can also change colours). I also sugget that you remove any color zone (yPic).
The indicator returns 1 for Long signals and -1 for short signals.
There is no provision for RSI crossovers. If you want to signal them just explain me what you want and, for ranging periods, how you want to detect them.
As for arrows, this is the version to be added ON your chart (not below like the other one) as from attached zPic:
// BB-Rsi-Rsi Divergences
//
// settings
//ONCE RsiP  = 14                           //14  RSI periods
//ONCE RsiOB = 70                           //70 - 30 (Overbought & Oversold)
//ONCE DivLB = 40                           //40  lookback periods for divergences
//ONCE BB    = 20                           //20  Bollinger Bands periods
ONCE RsiP    = max(1,min(999,RsiP))
ONCE RsiOB   = max(0,min(100,RsiOB))
ONCE DivLB   = max(1,min(999,DivLB))
ONCE RsiOS   = 100 - RsiOB
Offset       = average[50,0](range) * 2
// RSI divergences
MyDivergence = DivergenceRSI[RsiP,RsiOS,RsiOB,DivLB](close)
L1           = (MyDivergence = 1)           //bullish divergence
S1           = (MyDivergence = -1)          //bearish divergence
// RSI crossovers
MyRSI        = Rsi[14](close)
L2           = MyRsi CROSSES OVER  RsiOS    //bullish crossover
S2           = MyRsi CROSSES UNDER RsiOB    //bearish crossover
// BB (Bollinger Bands crossovers)
L3           = close CROSSES OVER  BollingerDOWN[BB]
S3           = close CROSSES UNDER BollingerUP[BB]
// combine Long & Short conditions
Lcond       = L1 AND L2 AND L3
Scond       = S1 AND S2 AND S3
// return the correct triggering signal
//Signal      = 0
IF Lcond THEN
   //Signal = 1        //LONG  Signal
   DrawArrowUP(BarIndex,low -Offset) coloured(0,128,0,150)
ELSIF Scond THEN
   //Signal = -1       //SHORT Signal
   DrawArrowDOWN(BarIndex,high + Offset) coloured(255,0,0,255)
ENDIF
RETURN //Signal AS "(Signal: 1=↑, -1=↓)    ",0 AS "Zero"
Hola Roberto
I don’t see the coefficient of the bollinger bands ? how can we add it ?…
thank you
BollingerUP and BollingerDOWN have a built-in 2.0 standard deviation that cannot be changed.
They need to be replaced by a custom BB calculation:
BBp    = 20                                  //20   BB periods
BBdev  = 2.0                                 //2.0  BB deviation
BBavg  = average[BBp,0](close)               //BB mean (middle line)
BollUP = BBavg + ((std[BBp](close)) * BBdev) //BB Upper Band
BollDN = BBavg - ((std[BBp](close)) * BBdev) //BB Lower Band
then replace BolligerUP and BolligerDOWN with BollUP and BollDN, respectively.
thank you so much Roberto
// BB-Rsi-Rsi Divergences Arrows  by RobertoGozzi
//
// settings
//ONCE RsiP  = 14 perso =12                 //14  RSI periods
//ONCE RsiOB = 70                           //70 - 30 (Overbought & Oversold)
//ONCE DivLB = 40 perso = 30                //40  lookback periods for divergences
//ONCE BB    = 20 perso = 34                //20  Bollinger Bands periods
ONCE RsiP    = max(1,min(999,RsiP))
ONCE RsiOB   = max(0,min(100,RsiOB))
ONCE DivLB   = max(1,min(999,DivLB))
ONCE RsiOS   = 100 - RsiOB
Offset       = average[50,0](range) * 2
// RSI divergences
MyDivergence = DivergenceRSI[RsiP,RsiOS,RsiOB,DivLB](close)
L1           = (MyDivergence = 1)           //bullish divergence
S1           = (MyDivergence = -1)          //bearish divergence
// RSI crossovers
MyRSI        = Rsi[12](close)
L2           = MyRsi CROSSES OVER  RsiOS    //bullish crossover
S2           = MyRsi CROSSES UNDER RsiOB    //bearish crossover
///////////////////////////////////////////////////////////////////////////
BBp    = 20                                   //20   BB periods
BBdev  = 2                                 //2.0  BB deviation
BBavg  = average[BBp,0](close)               //BB mean (middle line)
BollUP = BBavg + ((std[BBp](close)) * BBdev) //BB Upper Band
BollDN = BBavg - ((std[BBp](close)) * BBdev) //BB Lower Band
//then replace BolligerUP and BolligerDOWN with BollUP and BollDN, respectively.

// BB (Bollinger Bands crossovers)
L3           = close CROSSES OVER  BollDN [BBp]  //BollingerDOWN[BB]
S3           = close CROSSES UNDER BollUP [BBp]  //BollingerUP[BB]
//////////////////////////////////////////////////////////////////////////
// combine Long & Short conditions
Lcond       = L1 AND L2 AND L3
Scond       = S1 AND S2 AND S3
// return the correct triggering signal
//Signal      = 0
IF Lcond THEN
//Signal = 1        //LONG  Signal
DrawArrowUP(BarIndex,low -Offset) coloured(0,128,0,150)
ELSIF Scond THEN
//Signal = -1       //SHORT Signal
DrawArrowDOWN(BarIndex,high + Offset) coloured(255,0,0,255)
ENDIF
RETURN //Signal AS "(Signal: 1=↑, -1=↓)    ",0 AS "Zero"
Is this code is right ? because my signal on “banco de sabadell” on October 6th with the same parameters is missing ?