Simulated Trading
Forums › ProRealTime English forum › ProOrder support › Simulated Trading
- This topic has 52 replies, 7 voices, and was last updated 5 years ago by
 zilliq.
Tagged: equity curve, simulated trades
-
-
09/14/2018 at 11:44 AM #80482
As Nicolas has posted a great new blog on using simulated trading to improve strategy performance at:
https://www.prorealcode.com/blog/learning/how-to-improve-a-strategy-with-simulated-trades-1/
I thought that I would post something a little similar (but not as good!) that I wrote a while back. I have never used it in anger in a live or demo strategy as I felt the value of the average period was too critical as to whether it worked well or not. Maybe a better filter can be used?
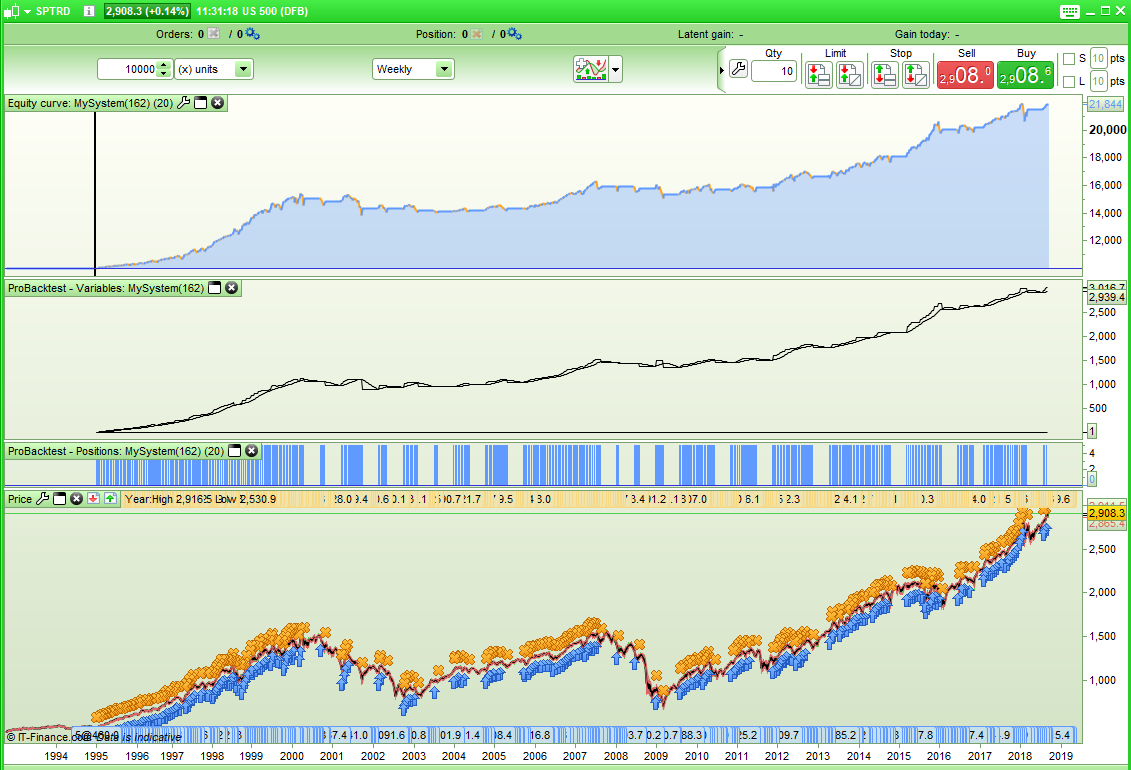
1234567891011121314151617181920212223242526272829303132333435x = 20 //average periodpositionsize = 5 //tradesizeif equitycurve >= average[x](equitycurve) or tradecount <= x thentrading = 1endifif equitycurve < average[x](equitycurve) and tradecount > x thentrading = 0endifif trading and not onmarket thenbuy positionsize contracts at marketbuyprice = closetradecount = tradecount + 1endifif trading = 0 and not onmarket thenbuyprice = closetradeonmarket = 1endifif onmarket and close > positionprice or onmarket and close > high[1] thensell at marketequitycurve = equitycurve + (close - buyprice)endifif tradeonmarket and close > buyprice or tradeonmarket and close > high[1] thentradeonmarket = 0equitycurve = equitycurve + (close - buyprice)endifgraph equitycurvegraph average[x](equitycurve)graph tradingI tested it on the SP500 weekly. Obviously there is no real strategy involved as it just buys every week if it is not on the market and sells at the close of a week if it is in profit or if the week has closed higher than the previous weeks high.
As with all uses of an average it will be curve fitted dependent on the average period selected. Also just like Nicolas’s example the filter does not come into play until x number of trades have passed. It would be possible to alter the code so that these are either real trades or simulated trades depending on your appetite for risk I guess.
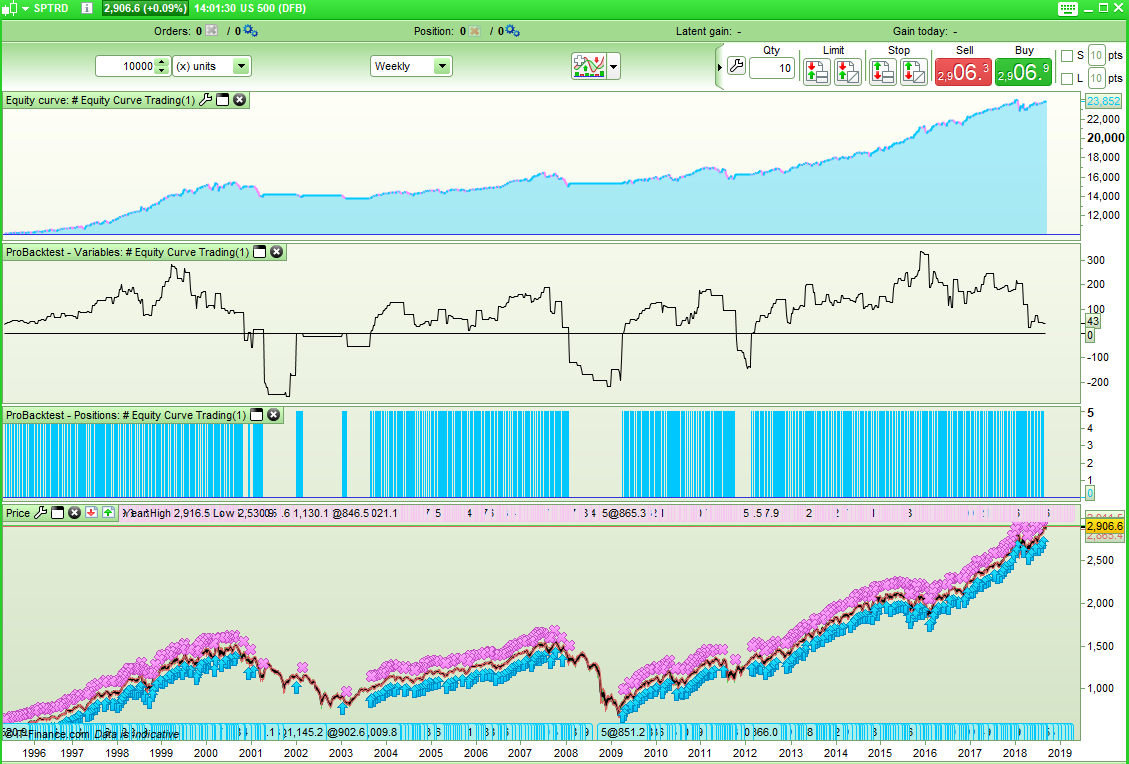
Here are the results with a period of 20:
Maybe a discussion on similar codes and the use of simulated trades will be of interest to someone?
1 user thanked author for this post.
09/14/2018 at 12:12 PM #80486Thanks for sharing your version.
In your code you are averaging the equity curve with a period set in time (quantity of candlesticks), so stop me if I’m wrong but the real trading could begin again if the time has passed by sufficiently for the equity curve to be computed with X same value.
Average[X](data) will get the last X data in the last X candlesticks, so if data is not changing you could have X times the same data, so the average is wrong 😐
I made something similar in this old blog article: Trading the strategy profit curve
09/14/2018 at 12:35 PM #8048809/14/2018 at 2:09 PM #80498Here’s the same strategy entry and exit criteria but this one keeps a simulated record of the last 10 trades. If the last 10 trades add up to an overall loss then real trading stops and simulated trades are recorded. Real trading does not resume until the last last ten trades have returned to an overall profit.
Once again the filter is not applied to the first 10 trades.
12345678910111213141516171819202122232425262728293031323334353637383940414243444546474849505152535455x = 10positionsize = 5lasttradestotal = trade1 + trade2 + trade3 + trade4 + trade5 + trade6 + trade7 + trade8 + trade9 + trade10if lasttradestotal >= 0 or tradecount <= x thentrading = 1endifif lasttradestotal < 0 and tradecount > x thentrading = 0endifif trading and not onmarket thenbuy positionsize contracts at marketbuyprice = closetradecount = tradecount + 1endifif trading = 0 and not onmarket thenbuyprice = closetradeonmarket = 1endifif onmarket and close > positionprice or onmarket and close > high[1] thensell at markettrade1 = trade2trade2 = trade3trade3 = trade4trade4 = trade5trade5 = trade6trade6 = trade7trade7 = trade8trade8 = trade9trade9 = trade10trade10 = close - buypriceendifif tradeonmarket and close > buyprice or tradeonmarket and close > high[1] thentradeonmarket = 0trade1 = trade2trade2 = trade3trade3 = trade4trade4 = trade5trade5 = trade6trade6 = trade7trade7 = trade8trade8 = trade9trade9 = trade10trade10 = close - buypriceendif//graph tradinggraph lasttradestotalgraph 009/14/2018 at 2:17 PM #80501This version will start applying the filter after the first trade as I realised that it is not necessary to wait. If the first trade loses then simulated trades are recorded but if it is a winner then live trading continues until the strategy goes into its first 10 trade negative equity.
1234567891011121314151617181920212223242526272829303132333435363738394041424344454647484950515253positionsize = 5lasttradestotal = trade1 + trade2 + trade3 + trade4 + trade5 + trade6 + trade7 + trade8 + trade9 + trade10if lasttradestotal >= 0 thentrading = 1endifif lasttradestotal < 0 thentrading = 0endifif trading and not onmarket thenbuy positionsize contracts at marketbuyprice = closeendifif trading = 0 and not onmarket thenbuyprice = closetradeonmarket = 1endifif onmarket and close > positionprice or onmarket and close > high[1] thensell at markettrade1 = trade2trade2 = trade3trade3 = trade4trade4 = trade5trade5 = trade6trade6 = trade7trade7 = trade8trade8 = trade9trade9 = trade10trade10 = (close - buyprice) * positionsizeendifif tradeonmarket and close > buyprice or tradeonmarket and close > high[1] thentradeonmarket = 0trade1 = trade2trade2 = trade3trade3 = trade4trade4 = trade5trade5 = trade6trade6 = trade7trade7 = trade8trade8 = trade9trade9 = trade10trade10 = (close - buyprice) * positionsizeendif//graph tradinggraph lasttradestotalgraph 01 user thanked author for this post.
09/14/2018 at 3:04 PM #8051109/14/2018 at 4:17 PM #80519While typing it I was thinking that access to arrays would be nice!
I guess it would be an improvement to most strategies even losing ones but then there is always the chance that you could have a big loss that keeps you out of the market for the next nine small wins and then just when you get back to live trading another big loss. I suppose that for trading strategies where the wins are a similar size to the losers then this sort of filter might be more beneficial.
In the weekly SP500 example shown it seems like a reasonable filter to keep a long only strategy out of the market in major corrections.
09/15/2018 at 2:42 PM #80577I thought it would be nice to see if the ten day floating equity curve as a filter would improve a random strategy. So I wrote a strategy that bought the SP500 after a three day drop and sold if the price went over an average – nothing else – no stops or take profits and no more than one position held at a time. I used a spread of 1.6.
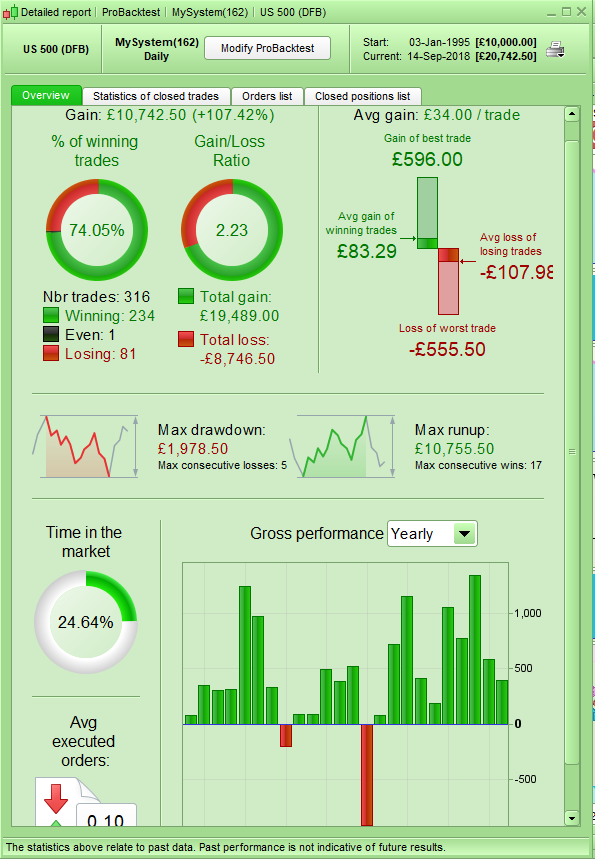
Here are the results:
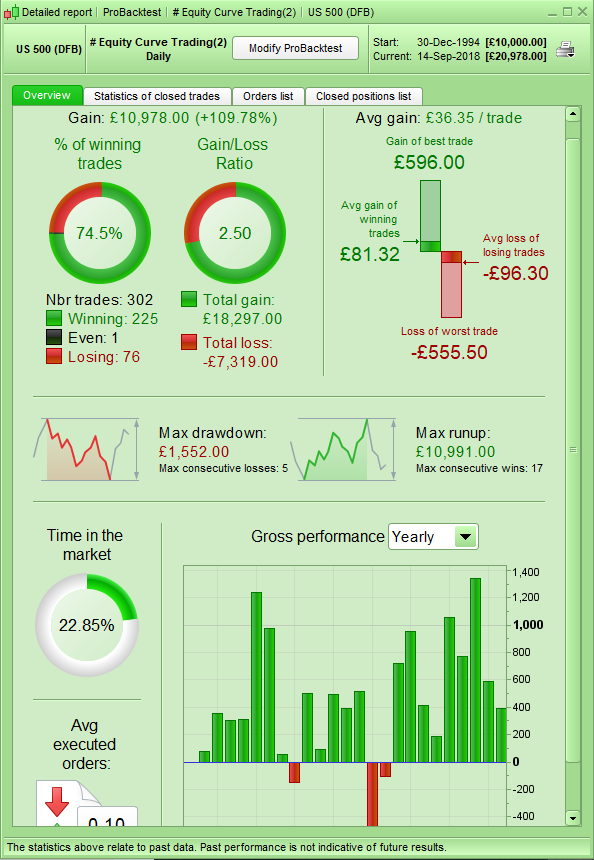
Then I added the ten trade floating equity curve filter to see if it improved it at all. Here are the results:
The conclusion was that using the filter resulted in more profit, slightly better gain per trade, slightly better win ratio, less time in the market but most importantly a big improvement in draw down.
This sort of equity curve filtering may have some merit it seems but further testing is needed on the effect of such things such as number of trades used to calculate the floating equity curve before a full conclusion can be reached.
1 user thanked author for this post.
09/17/2018 at 7:58 AM #80661More patterns for your tests: http://paststat.com/quant-ideas
1 user thanked author for this post.
09/17/2018 at 12:06 PM #80683Another idea I am testing is comparing a five trade floating equity curve with a ten trade floating equity curve and only trading live if the ten trade curve is above the five trade curve.
12345678910111213141516171819202122232425262728293031323334353637383940414243444546474849lasttradestotal = trade1 + trade2 + trade3 + trade4 + trade5 + trade6 + trade7 + trade8 + trade9 + trade10lasttradestotal5 = trade1 + trade2 + trade3 + trade4 + trade5if lasttradestotal >= lasttradestotal5 thentrading = 1endifif lasttradestotal < lasttradestotal5 thentrading = 0endifif trading and not onmarket thenbuy 5 contracts at marketbuyprice = closeendifif trading = 0 and not onmarket thenbuyprice = closetradeonmarket = 1endifif onmarket and close > positionprice or onmarket and close > high[1] thensell at markettrade1 = trade2trade2 = trade3trade3 = trade4trade4 = trade5trade5 = trade6trade6 = trade7trade7 = trade8trade8 = trade9trade9 = trade10trade10 = (close - buyprice) * positionsizeendifif tradeonmarket and close > buyprice or tradeonmarket and close > high[1] thentradeonmarket = 0trade1 = trade2trade2 = trade3trade3 = trade4trade4 = trade5trade5 = trade6trade6 = trade7trade7 = trade8trade8 = trade9trade9 = trade10trade10 = (close - buyprice) * positionsizeendif1 user thanked author for this post.
09/17/2018 at 2:28 PM #8070309/18/2018 at 7:59 AM #80735You have almost rewrote “Dual momentum” theory from scratch
Almost… but with errors! I just noticed that I am comparing the first 5 trades in the 10 recorded trades instead of the last 5 trades. Here is the corrected code:
12345678910111213141516171819202122232425262728293031323334353637383940414243444546474849lasttradestotal = trade1 + trade2 + trade3 + trade4 + trade5 + trade6 + trade7 + trade8 + trade9 + trade10lasttradestotal5 = trade6 + trade7 + trade8 + trade9 + trade10if lasttradestotal >= lasttradestotal5 thentrading = 1endifif lasttradestotal < lasttradestotal5 thentrading = 0endifif trading and not onmarket thenbuy 5 contracts at marketbuyprice = closeendifif trading = 0 and not onmarket thenbuyprice = closetradeonmarket = 1endifif onmarket and close > positionprice or onmarket and close > high[1] thensell at markettrade1 = trade2trade2 = trade3trade3 = trade4trade4 = trade5trade5 = trade6trade6 = trade7trade7 = trade8trade8 = trade9trade9 = trade10trade10 = (close - buyprice) * positionsizeendifif tradeonmarket and close > buyprice or tradeonmarket and close > high[1] thentradeonmarket = 0trade1 = trade2trade2 = trade3trade3 = trade4trade4 = trade5trade5 = trade6trade6 = trade7trade7 = trade8trade8 = trade9trade9 = trade10trade10 = (close - buyprice) * positionsizeendif1 user thanked author for this post.
12/13/2020 at 8:45 AM #153539My question is if trades could be simulated until it exceeds the drawdown.
That is to say:
Win
Win
Win
Lose, and the drawdown begins
Lose, sham operation
Win, simulated trade, still not over drawdown
Win, simulated trade, still not over drawdown
Win, simulated trade, and beat the drawdown
Start trading real money again.
Its possible?… I need code!
Thanks!!!
12/16/2020 at 2:25 PM #15398312/18/2020 at 3:22 PM #154301 -
AuthorPosts
Find exclusive trading pro-tools on 


