Swing alto e swing basso
Forums › ProRealTime forum Italiano › Supporto ProBuilder › Swing alto e swing basso
- This topic has 6 replies, 3 voices, and was last updated 6 years ago by
 robertogozzi.
-
-
03/07/2018 at 1:52 AM #64637Swing alto e Swing basso12345678910111213141516171819//Swing high:c1=High < High[1]c2=Close < Openc3=High[1] > High[2]//Swing low:c4=Low > Low[1]c5=Close > Openc6=Low[1] < Low[2]if c1 and c2 and c3 thenDRAWSEGMENT(barindex, high, barindex[200], high)elsif c4 and c5 and c6 thenDRAWSEGMENT(barindex, low, barindex[200], low)endifreturn
Salve, vorrei chiedere un aiuto per modificare il codice riportato sopra, perchè le linee che vengono tirate vanno verso sinistra, mentre io le vorrei verso destra.
Inoltre vorrei chiedere se è possibile spostare la linea sul corpo della candela centrale dello swing.
Sperando che le modifiche possano essere fattibili, ringrazio e saluto.
03/07/2018 at 9:41 AM #64653Ecco il codice:
1234567891011121314151617181920212223242526272829DEFPARAM CalculateOnLastBars = 2000//defparam drawonlastbaronly = trueONCE SwingBarUp = 0ONCE SwingBarDn = 0ONCE SwingUp = 0ONCE SwingDn = 0//Swing high:c1=High < High[1]c2=Close < Openc3=High[1] > High[2]//Swing low:c4=Low > Low[1]c5=Close > Openc6=Low[1] < Low[2]if c1 and c2 and c3 thenSwingBarUp = BarIndex[1]SwingUp = high[1]elsif c4 and c5 and c6 thenSwingBarDn = BarIndex[1]SwingDn = low[1]endifDRAWSEGMENT(SwingBarUp, SwingUp, barindex, SwingUp) coloured(0,0,255,255)DRAWSEGMENT(SwingBarDn, SwingDn, barindex, SwingDn) coloured(255,0,0,255)returnLa riga 1 l’ho messa per velocizzare l’inserimento ed il ricalcolo dell’indicatore.
La seconda riga l’ho messa commentata. Serve a visualizzare i segmenti solo sull’ultima barra. Così com’è li vedi tutti.
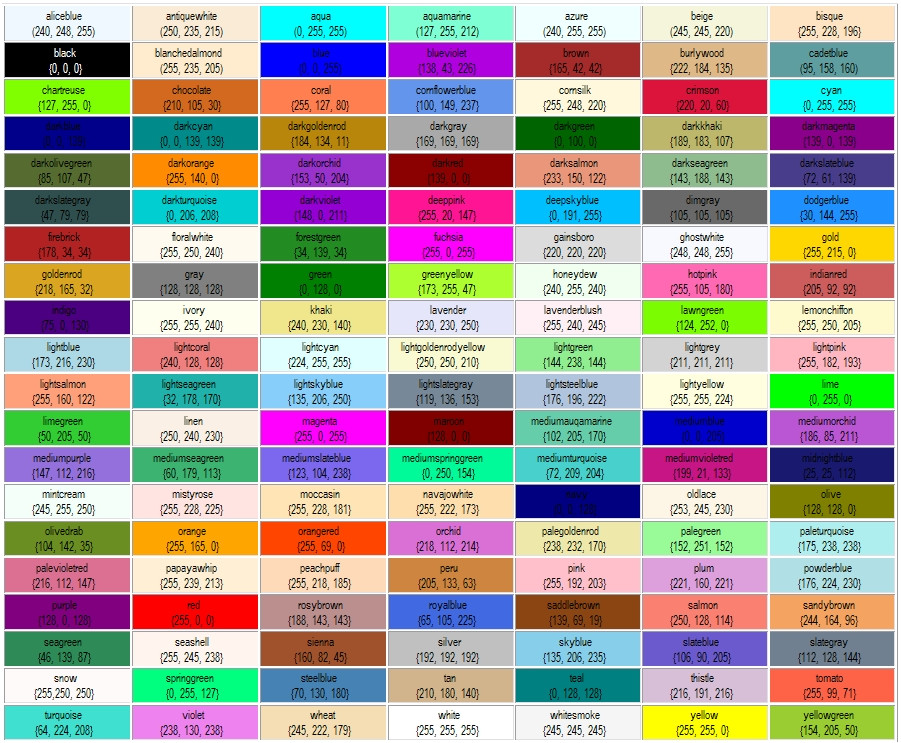
Ho anche colorato i segmenti in modo diverso, se non t’interessa togli l’istruzione COLOURED, oppure puoi modificarne i valori (https://www.prorealcode.com/wp-content/uploads/2015/09/P1jHlnG.jpg).
03/09/2018 at 1:57 AM #6486904/05/2019 at 4:56 PM #95563Ciao Roberto
ho trovato nella library questo codice di indicatore ma non ho capito il criterio con il quale compaione le frecce sul grafico
Mi puoi aiutare a capire ?
Grazie
1234567891011121314151617181920212223242526272829303132333435363738394041424344454647//computation of the radius to draw ellipsesradius=average[200](range)/4//formula to compute short term swing pointsif (high>alto[1]) and not (high<high[1] and low>low[1]) thenalto=highbasso=lowmarkup=barindexmarkhigh=highendifif (low<basso[1]) and not (high<high[1] and low>low[1]) thenalto=highbasso=lowmarkdown=barindexmarklow=lowendifif alto<alto[1] and trend=1 thentrend=0drawarrowdown(markup,markhigh)mediummarkup=shortmarkupshortmarkup=markuplongmarkhigh=mediummarkhighmediummarkhigh=shortmarkhighshortmarkhigh=markhigh//intermediate high swing pointsif longmarkhigh<mediummarkhigh and mediummarkhigh>shortmarkhigh thenDRAWELLIPSE(mediummarkup-1, mediummarkhigh-radius, mediummarkup+1, mediummarkhigh+radius)endifendifif basso>basso[1] and trend=0 thentrend=1drawarrowup(markdown,marklow)mediummarkdown=shortmarkdownshortmarkdown=markdownlongmarklow=mediummarklowmediummarklow=shortmarklowshortmarklow=marklow//intermediate low swing pointsif longmarklow>mediummarklow and mediummarklow<shortmarklow thenDRAWELLIPSE(mediummarkdown-1, mediummarklow-radius, mediummarkdown+1, mediummarklow+radius)endifendifdrawcandle(open,high,low,close)return04/05/2019 at 5:02 PM #95564Per scrivere il codice , utilizza il pulsante <> “insert PRT code”, in modo da rendere il codice più comprensibile. Grazie.
Puoi postare un link alla pagina dove l’hai trovato?
04/05/2019 at 5:46 PM #95574William's High and low123456789101112131415161718192021222324252627282930313233343536373839404142434445464748//computation of the radius to draw ellipsesradius=average[200](range)/4//formula to compute short term swing pointsif (high>alto[1]) and not (high<high[1] and low>low[1]) thenalto=highbasso=lowmarkup=barindexmarkhigh=highendifif (low<basso[1]) and not (high<high[1] and low>low[1]) thenalto=highbasso=lowmarkdown=barindexmarklow=lowendifif alto<alto[1] and trend=1 thentrend=0drawarrowdown(markup,markhigh)mediummarkup=shortmarkupshortmarkup=markuplongmarkhigh=mediummarkhighmediummarkhigh=shortmarkhighshortmarkhigh=markhigh//intermediate high swing pointsif longmarkhigh<mediummarkhigh and mediummarkhigh>shortmarkhigh thenDRAWELLIPSE(mediummarkup-1, mediummarkhigh-radius, mediummarkup+1, mediummarkhigh+radius)endifendifif basso>basso[1] and trend=0 thentrend=1drawarrowup(markdown,marklow)mediummarkdown=shortmarkdownshortmarkdown=markdownlongmarklow=mediummarklowmediummarklow=shortmarklowshortmarklow=marklow//intermediate low swing pointsif longmarklow>mediummarklow and mediummarklow<shortmarklow thenDRAWELLIPSE(mediummarkdown-1, mediummarklow-radius, mediummarkdown+1, mediummarklow+radius)endifendifdrawcandle(open,high,low,close)return04/05/2019 at 6:04 PM #95578E’ l’indicatore che si trova qui https://www.prorealcode.com/prorealtime-indicators/williams-highs-lows/ (questo è il link).
Segnala, mi pare, dei punti di swing. Per saperlo dovresti leggere il libro che è segnalato insieme all’indicatore. Io non ne ho un’idea precisa.
Posso dirti, però, perché qualcuno lo ha chiesto mesi fa, che non è possibile usarlo in strategie automatizzate, in quanto disegna ellissi/frecce DOPO la candela dove appaiono, per cui al momento della chiusura della candela (quando la strategia viene eseguita) non è dato sapere ancora se quella candela sarà successivamente segnalata.
Si può usare benissimo per il trading manuale, dopo averne capito il funzionamento. Se fai una ricerca su internet magari trovi spiegazioni esaurienti anche senza leggere il libro.
-
AuthorPosts
Find exclusive trading pro-tools on ![]()