The next ProRealTime version 10.3 and new graphical functionnalities
Forums › ProRealTime English forum › ProRealTime platform support › The next ProRealTime version 10.3 and new graphical functionnalities
- This topic has 33 replies, 6 voices, and was last updated 9 years ago by
enzo_52.
-
-
02/29/2016 at 11:19 AM #3304
Hello,
I have currently access to the new 10.3 Beta version of ProRealTime and the new possibilities are enormous.
Along the purely “trading” ones (for which i’ll come back later), the new graphical instructions give us, at least, the possibility to draw many things on charts! FYI i had the new graphical instructions in the documentation here : http://www.prorealcode.com/documentation/category/graphical/ where i have already post some little examples.
In this topic i’ll add some new examples of what it’s already possible to achieve in the next generation of ProRealTime!
From arrows signals to complete new dashboard, anyone could make its own “new trading platform”! 🙂 with prorealtime 10.3
I’m gonna add things frequently into this thread, you can subscribe or check it often.
Please be aware that everything posted here are only 10.3 version compatible (code), thanks!
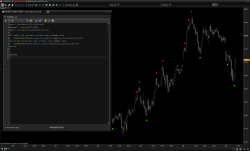
02/29/2016 at 12:00 PM #3307Here we go, something a lot of people are awaiting for : draw some arrows to show signals of trading conditions.
At least, a simple stochastic crossing can be drawn visually into our charts :
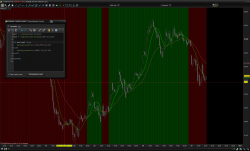
1234567891011sto = Stochastic[10,3](close)signal = average[5](sto)rge = averagetruerange[10](close)if sto[1]>80 and sto crosses under signal thenDRAWARROWDOWN(barindex[1],high[1]+rge/2)coloured(255,10,10)elsif sto[1]<20 and sto crosses over signal thenDRAWARROWUP(barindex[1],low[1]-rge/2)coloured(10,255,10)endifRETURN02/29/2016 at 12:33 PM #3309Changing the background color is also now possible.
Here i am simply “coloring” the background chart with red and green colours that reflect the spread between 2 moving averages :
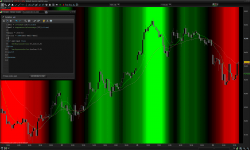
12345678910mm1 = average[10](close)mm2 = exponentialaverage[30](close)if mm1>mm2 thenbackgroundcolor(10,255,10,50)elsebackgroundcolor(255,10,10,50)endifRETURN02/29/2016 at 1:11 PM #3311It’s easy to make gradient colour to show greater or less value. Here is an example to show the spread between 2 moving average with a dynamic scaling :
12345678910111213mm1 = average[10](close)mm2 = exponentialaverage[30](close)maxi = 200/50color = ABS(mm1-mm2)*maxiif mm1>mm2 thenbackgroundcolor(0,color,0)elsebackgroundcolor(color,0,0)endifRETURNIn this example, 50 points of spread is the maximum value of the color, set to 200.
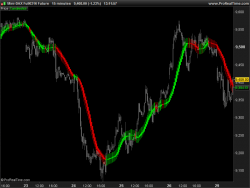
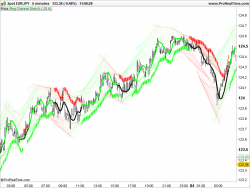
02/29/2016 at 1:40 PM #3316We can now draw customized candlestick and barchart! Imagine that you can set any Open/High/Low/Close values to build your own personalized candles, on chart or in separated windows, like an oscillator.
Drawing Heiken Ashi, smoothed version with values of 4 moving average (MA of 20 period set on Open, High, Low and Close) :
The code example is here in the documentation : http://www.prorealcode.com/documentation/drawcandle/
I have set the bordercolor differently from the candle color itself, because you can now also customize the colour of the border of candles.
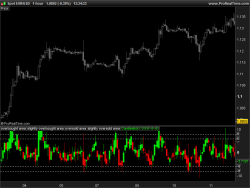
Another example of using customize candlestick is to make oscillator, here is the 10.3 version of the “value chart” :
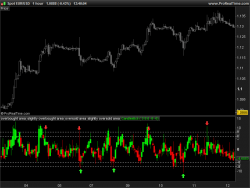
and a nice value chart with alert arrows :
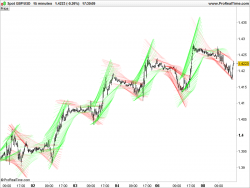
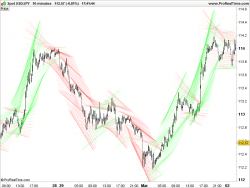
02/29/2016 at 6:13 PM #332103/08/2016 at 5:42 PM #3505I have seen something similar elsewhere recently so i decided to make my own version of this channel sketcher for the new ProRealTime with the new “DRAWSEGMENT” function.
This is a regression channel sketcher that draw segment other highs and lows over a ‘p’ period. The alpha gradient is calculated with the difference between the top and bottom channel to made it easier to “read”.
123456789101112131415161718192021222324252627282930313233p=20z1 = linearregression[p](high)z2 = linearregression[p](low)y1 = 1.5*std[p](high)+z1y2 = 1.5*-std[p](low)+z2if(y1>y1[p]) thenRh = 0Gh = 255elseRh = 255Gh = 0endifif(y2>y2[p]) thenRl = 0Gl = 255elseRl = 255Gl = 0endifa = (255*(y1-y2))/(300*pipsize)if a>255 thena = 255endifDRAWSEGMENT(barindex-p*1.5,y1[p],barindex+10,y1)coloured(Rh,Gh,0,a)DRAWSEGMENT(barindex-p*1.5,y2[p],barindex+10,y2)coloured(Rl,Gl,0,a)RETURN03/09/2016 at 11:05 AM #3514Drawing text on chart is now possible. You can even use ASCII character for drawing symbol-like on chart with the instruction http://www.prorealcode.com/documentation/drawtext/
1DRAWTEXT("│", barindex, y2[1], Dialog, Bold, 12) COLOURED(10,255,10,255)In order to use ASCII character you just have to use the ALT keyboard button + the ASCII number of the character you’d like to use, “179” in my case :
03/09/2016 at 3:07 PM #3532hello world!
just stumbled upon ProRealCode forum today, great website 🙂
Im looking forward to v10.3 already, the ASCII text feature will get the Elliott wavers excited!
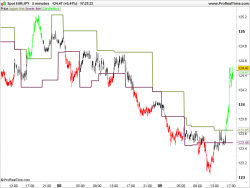
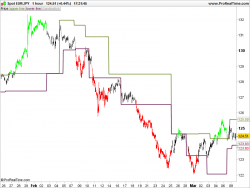
03/09/2016 at 3:22 PM #353403/09/2016 at 5:33 PM #3546Draw overlay candlesticks over price chart for signals spotting:
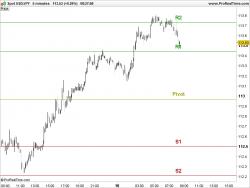
123456789101112131415161718192021222324252627282930313233343536373839p = 50hh = highest[p](high)[1]ll = lowest[p](low)[1]mmf = exponentialaverage[10](close)mms = exponentialaverage[30](close)once flag = 0if mmf>mms AND flag = -1 thenupper = hh[1]flag = 1endifif mmf<mms AND flag = 1 thenlower = ll[1]flag = -1endifif mmf crosses under mms thenflag = -1endifif mmf crosses over mms thenflag = 1endifif lower>upper thenlower=upperendifif flag = 1 AND Close>upper thenDRAWCANDLE(Open,High,Low,Close)COLOURED(0,255,0)elsif flag = -1 AND Close<lower thenDRAWCANDLE(Open,High,Low,Close)COLOURED(255,0,0)endifRETURN upper coloured(110,137,37,255) STYLE(line,2) as "upper line", lower coloured(111,30,85,255) STYLE(line,2) as "lower line"03/10/2016 at 8:32 AM #3556Draw text on chart and horizontal line with extension with the new instructions : DRAWTEXT and DRAWLINE
Here is an intraday Fibonacci pivot points indicator made of these 2 new probuilder instructions :
12345678910111213141516171819202122232425262728293031323334353637defparam drawonlastbaronly = true//yesterday's valuedh = DHigh(1)dl = DLow(1)//fibonacci pivot pointsP = (dh + dl + DClose(1))/3S1 = P - .382 * (dh-dl)S2 = P - .618 * (dh-dl)S3 = P - 1 * (dh-dl)R1 = P + .382 * (dh-dl)RR2 = P + .618 * (dh-dl)R3 = P + 1 * (dh-dl)//vertical offset to draw text correctly over horizontal linesVoffset = 5*pipsize//draw pivot points textDRAWTEXT("Pivot",barindex-2,p+Voffset,SansSerif,Bold,16)coloured(153,153,0)DRAWTEXT("R1",barindex-2,R1+Voffset,SansSerif,Bold,16)coloured(0,153,0)DRAWTEXT("R2",barindex-2,RR2+Voffset,SansSerif,Bold,16)coloured(0,153,0)DRAWTEXT("R3",barindex-2,R3+Voffset,SansSerif,Bold,16)coloured(0,153,0)DRAWTEXT("S1",barindex-2,S1+Voffset,SansSerif,Bold,16)coloured(153,0,0)DRAWTEXT("S2",barindex-2,S2+Voffset,SansSerif,Bold,16)coloured(153,0,0)DRAWTEXT("S3",barindex-2,S3+Voffset,SansSerif,Bold,16)coloured(153,0,0)//draw pivot points lines with extensionDRAWLINE(barindex-1,p,barindex,p) coloured(153,153,0)DRAWLINE(barindex-1,R1,barindex,R1) coloured(0,153,0)DRAWLINE(barindex-1,RR2,barindex,RR2) coloured(0,153,0)DRAWLINE(barindex-1,R3,barindex,R3) coloured(0,153,0)DRAWLINE(barindex-1,S1,barindex,S1) coloured(153,0,0)DRAWLINE(barindex-1,S2,barindex,S2) coloured(153,0,0)DRAWLINE(barindex-1,S3,barindex,S3) coloured(153,0,0)RETURN03/10/2016 at 9:01 AM #3560thanks for the welcome, wow DRAWLINE is going to be so useful. will ProScreener be able to see all these new functions?
03/10/2016 at 9:24 AM #356103/10/2016 at 9:58 AM #3562yer a little bit
looking at the code, the indicator is not returning any values (the Drawline is not creating an object on the screen but just a printed line?) so when called in ProScreener there is nothing to be passed in and worked with.
all the same still pretty cool 🙂
-
AuthorPosts
Find exclusive trading pro-tools on 
