Tick by tick not working correctly.
Forums › ProRealTime English forum › ProOrder support › Tick by tick not working correctly.
- This topic has 5 replies, 2 voices, and was last updated 6 years ago by
Vonasi.
-
-
06/30/2018 at 11:42 PM #74963
I have been testing a strategy which uses BUY LIMIT and SELL LIMIT orders on the daily chart with tick by tick data turned on. I have been getting too good to be true results so started looking closer at the daily data. It appears that the tick by tick is being ignored.
Here is an example. On the 21 June 2018 a BUY LIMIT order of 2752.3 was placed and a SELL LIMIT of 2768.7 was placed. The daily chart shows both limits being hit but a closer look at the 15 minute chart shows that the SELL LIMIT was never hit.
06/30/2018 at 11:57 PM #74966Having just tested with tick by tick on and tick by tick off over the same period I confirmed that tick by tick is not effective at all and it was at this point that I realised that the platform is not connected to PRT today (I assume you are doing some updating). I imagine that this is the reason for the error.
Anyone testing on tick by tick data today will be in for a shock if they put their strategy live on Monday. A notification or advisory warning might have been a good idea for everyone.
1 user thanked author for this post.
07/01/2018 at 4:11 PM #75021Well I am now connected back with PRT so they must have finished whatever they were doing. So I decided to test the strategy again with its buy limit and sell limit orders and it is still not using tick by tick data. So it seems that my theory was clearly wrong.
07/01/2018 at 4:40 PM #7502907/02/2018 at 9:11 AM #7505907/02/2018 at 10:05 AM #75070This morning I decided to carry out a test to confirm what is going wrong so I wrote this simple code. Tests carried out on DJI daily chart.
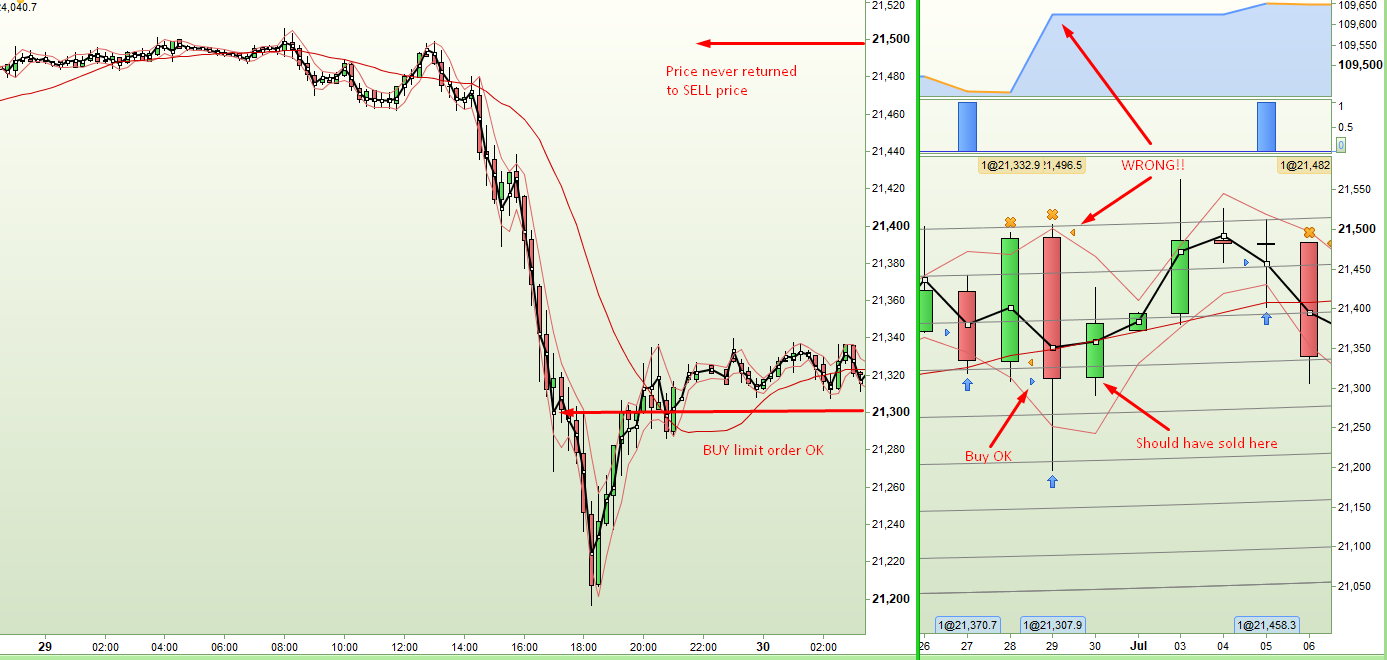
1234567891011121314defparam cumulateorders = falsea = lowb = highif close > close[300] and close > average[200] thenbuy 1 contract at a limitendifsell at b limitif onmarket thensell at marketendifIt buys using a limit order if price falls to yesterdays low and sells via a limit order at yesterdays high. If the high is not reached then it just closes the trade at the end of the candle. The backtest is too good to be true and closer inspection shows that the tick by tick is not working correctly. For example on 29 June 2017 it is clearly showing a very profitable trade when in reality the sell limit was never hit after the trade was opened.
Here is an image of the daily and 15 minute charts clearly showing this:
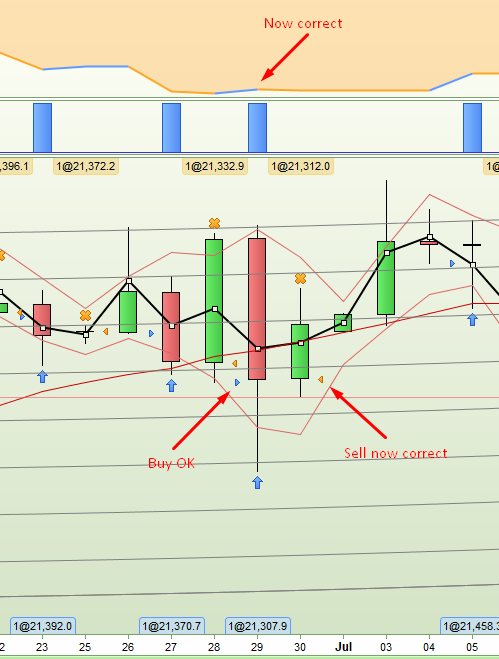
If I then replace the SELL LIMIT order with a SET TARGET PPROFIT order with a level of high minus low then the tick by tick works and all trades are correct.
123456789101112131415defparam cumulateorders = falsea = lowb = highif close > close[300] and close > average[200] thenbuy 1 contract at a limitendiftp = (b - a)set target pprofit tpif onmarket thensell at marketendifHere is the daily chart now showing the correct entry and exit:
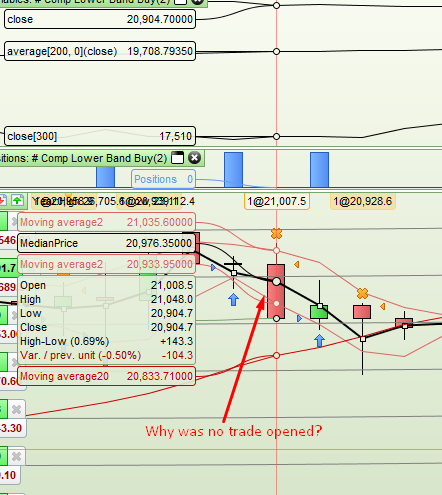
But even then I notice things that are not right. With either code no position is opened on 9 May 2017 when I can see no reason for it to not be opened. Price fell below the low of yesterday and both entry conditions are met as can be seen in the graph of the condition levels.
I will send a report to PRT if no one can explain a good reason for all these incorrect results when using tick by tick data.
-
AuthorPosts
Find exclusive trading pro-tools on 


